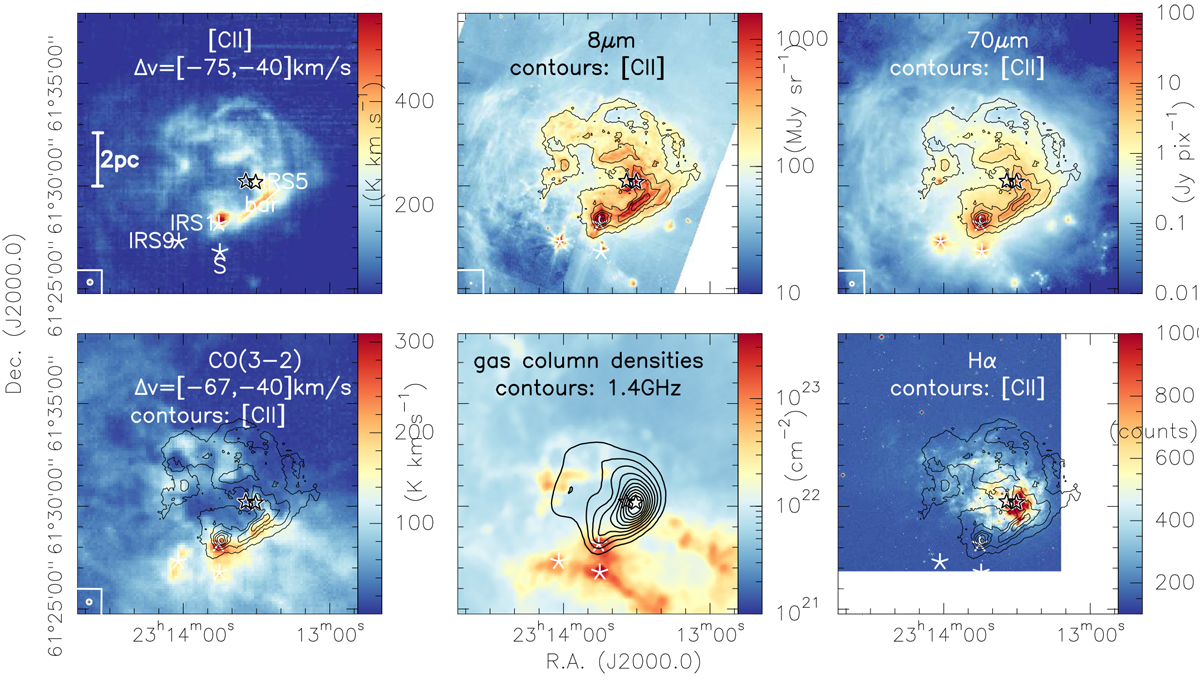
Fig. 2
Download original image
Integrated intensity molecular and atomic line maps as well as continuum emission are presented in color scale toward NGC 7538. The specific lines, integration ranges, and continuum bands are labeled in each panel. The corresponding angular resolution is shown at the bottom-left of the panels. The contours in most panels as labeled show the [CII] emission at only a few selected contour levels to highlight similarities and differences. The contours in the bottom-middle panel outline the 1.4 GHz cm continuum emission from the CGPS. The three five-pointed stars mark the positions of the embedded sources NGC 7538IRS1, NGC 7538S, and NGC 7538IRS9. The two stars in the middle show the positions of the two main exciting sources of the H II region NGC 7538IRS5 and NGC 7538IRS6. The bar-like PDR as well as a a linear scale bar are presented in the top-left panel.
Current usage metrics show cumulative count of Article Views (full-text article views including HTML views, PDF and ePub downloads, according to the available data) and Abstracts Views on Vision4Press platform.
Data correspond to usage on the plateform after 2015. The current usage metrics is available 48-96 hours after online publication and is updated daily on week days.
Initial download of the metrics may take a while.