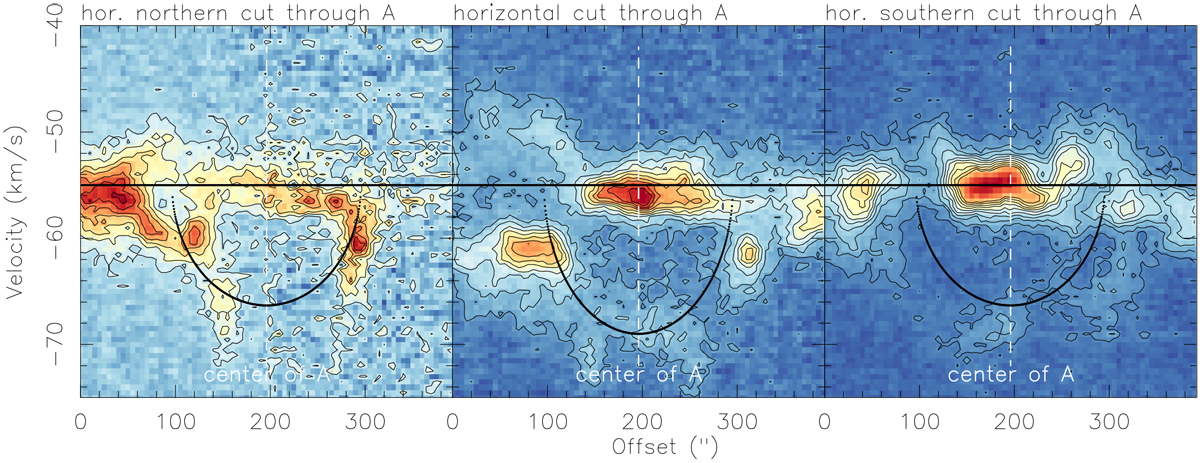
Fig. A.4

Download original image
Horizontal position-velocity cuts through bubble A from east to west derived from the [CII] line emission. The central panel goes through the estimated central position of A whereas the left and right panels are shifted 1′ to the north and south, respectively. The dashed line marks the approximate center of the bubble. The black dotted lines in the middle panel outline the elliptical shape a spherical shell with radius 100″ and expansion velocity of 14 km s−1 would have in the pv diagram. The dotted lines in the left and right panel correspond to the same expanding shell at the 1′ shift to the east and west where the 1′ corresponds to ~36 deg offset in the sphere (e.g., Butterfield et al. 2018, sketch in their appendix A.2). Hence, the velocities are then reduced by cos(36°).
Current usage metrics show cumulative count of Article Views (full-text article views including HTML views, PDF and ePub downloads, according to the available data) and Abstracts Views on Vision4Press platform.
Data correspond to usage on the plateform after 2015. The current usage metrics is available 48-96 hours after online publication and is updated daily on week days.
Initial download of the metrics may take a while.


