Open Access
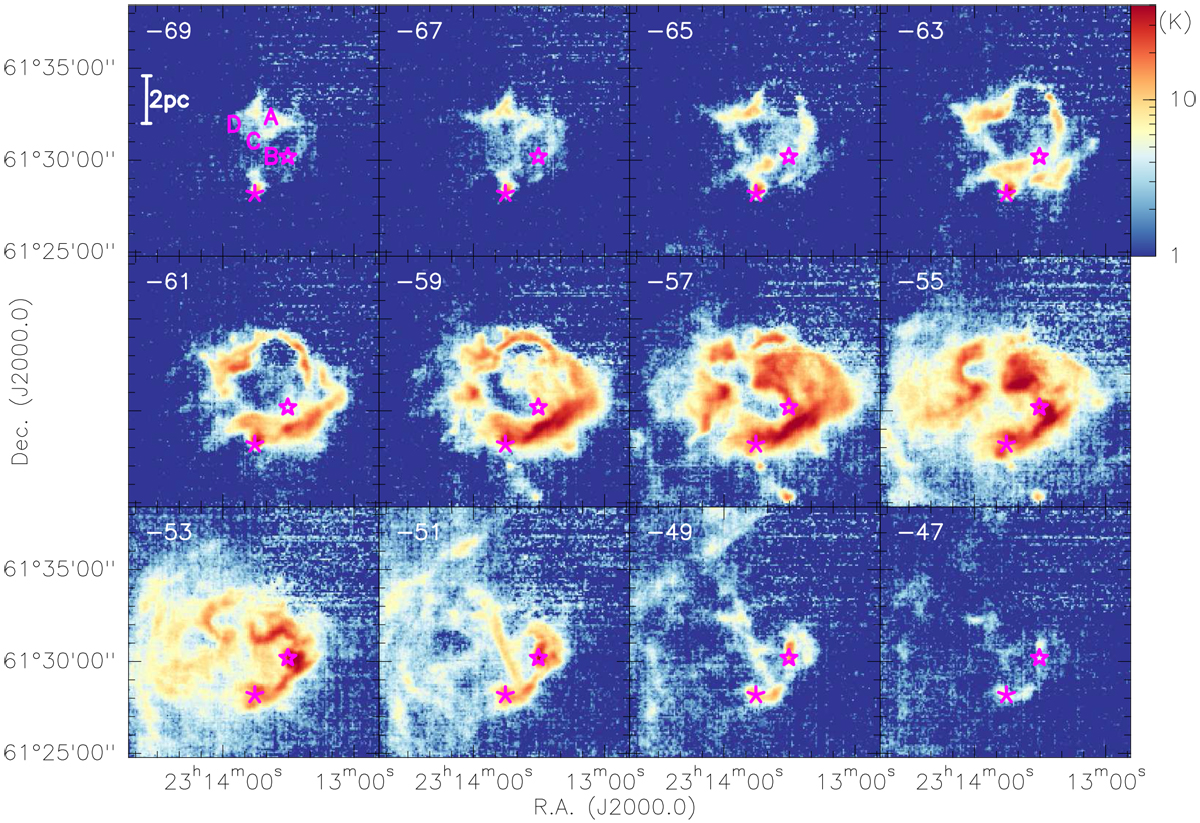
Fig. A.2
Download original image
[CII] channel map for the velocities labeled in each panel. The data are binned for that plot in 2 km s−1 channels. The two purple stars mark the positions of IRS1 and IRS5, and a scale bar is shown in the top-left panel. The intensities are always plotted logarithmically from 1 to 40 K.
Current usage metrics show cumulative count of Article Views (full-text article views including HTML views, PDF and ePub downloads, according to the available data) and Abstracts Views on Vision4Press platform.
Data correspond to usage on the plateform after 2015. The current usage metrics is available 48-96 hours after online publication and is updated daily on week days.
Initial download of the metrics may take a while.