Fig. 14
Download original image
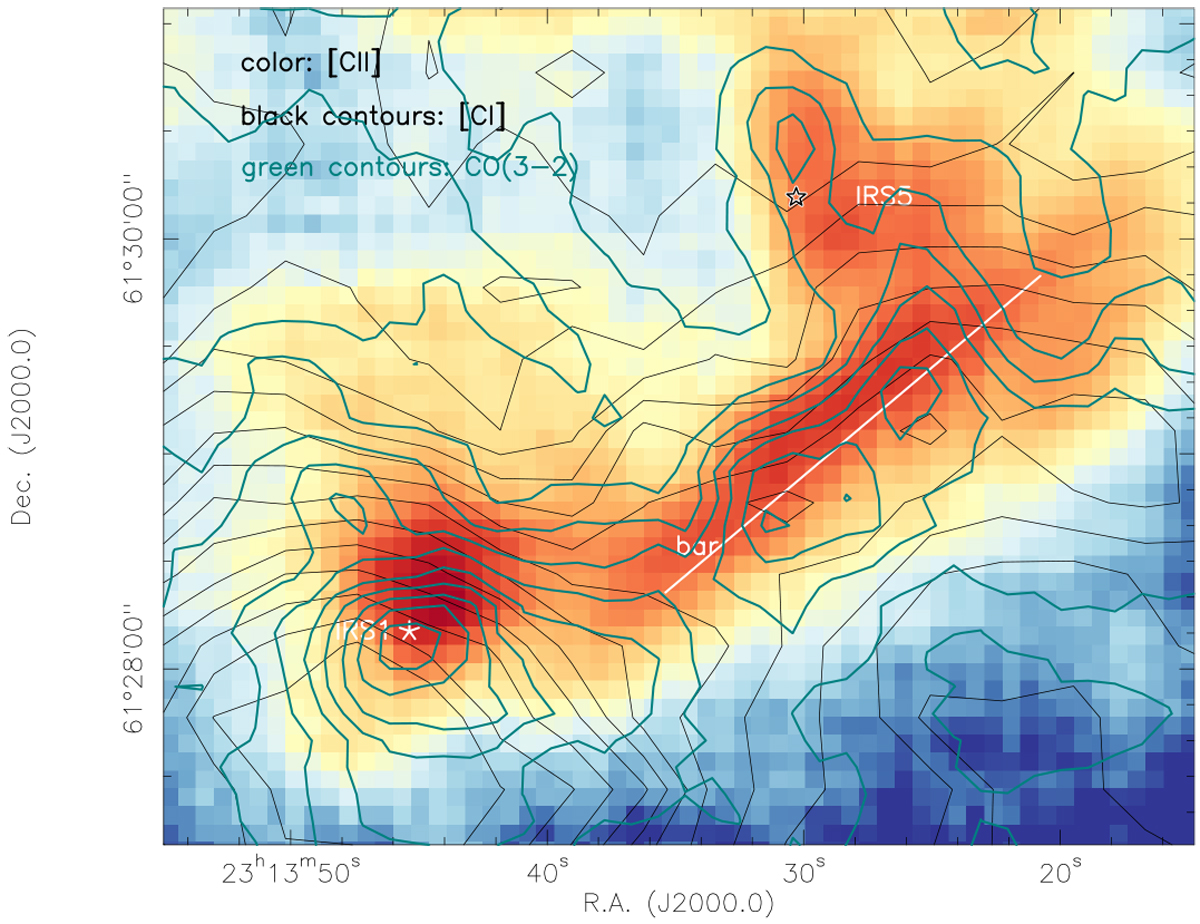
Integrated [CII] (color), [CI] (black contours), and CO(3–2) (green contours) emission in the bar region where the [CII]/[CI]/CO mass estimates are conducted (Sect. 4.3). All three maps were integrated between −70 and −40 km s−1. The [CI] contours start at 6σ and continuein 3σ steps (1σ = 1.6 K km s−1). The CO(3–2) contours start at 10σ and continuein 10σ steps (1σ = 3.2 K km s−1). The white line marks the approximate location of the bar-like feature.
Current usage metrics show cumulative count of Article Views (full-text article views including HTML views, PDF and ePub downloads, according to the available data) and Abstracts Views on Vision4Press platform.
Data correspond to usage on the plateform after 2015. The current usage metrics is available 48-96 hours after online publication and is updated daily on week days.
Initial download of the metrics may take a while.