Fig. 12
Download original image
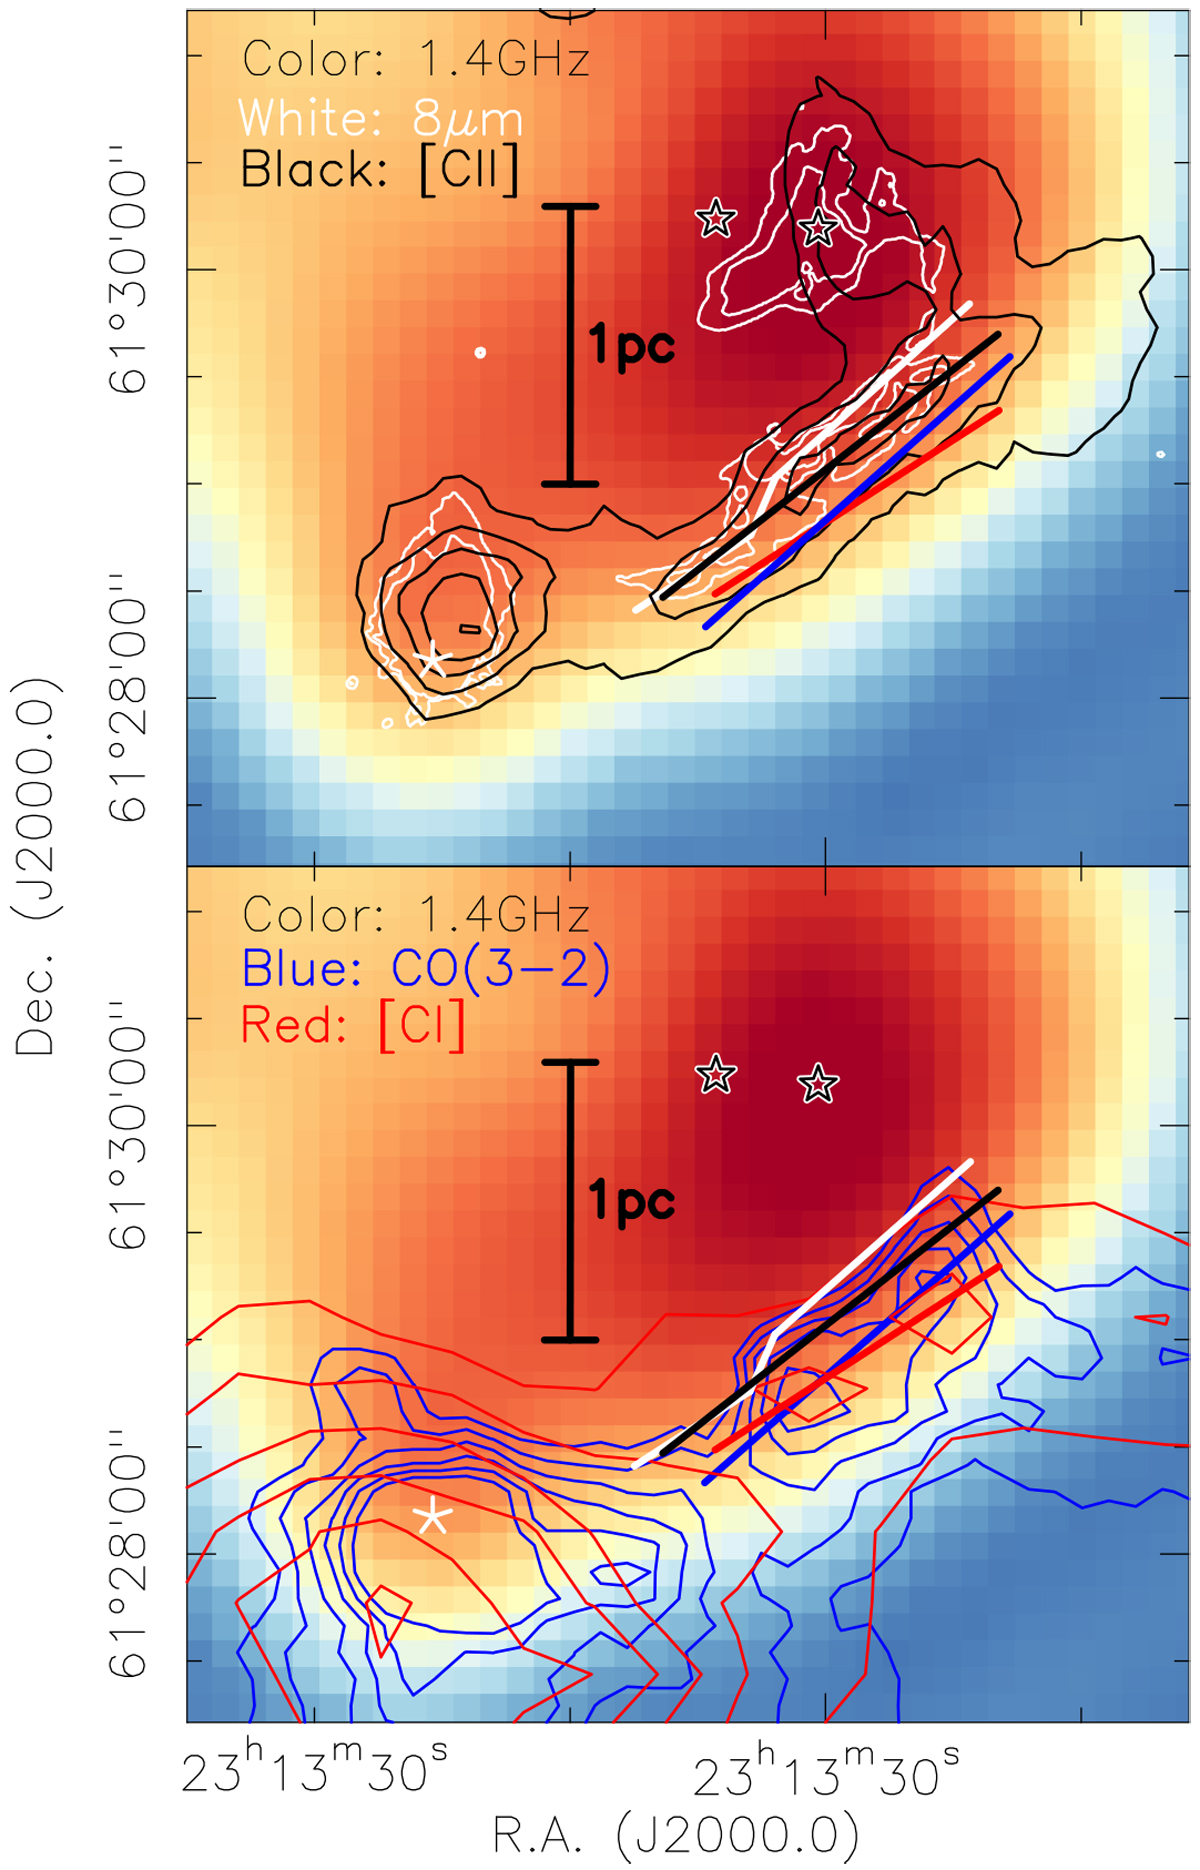
Zoom on the bar-region south of the exciting sources IRS5 and IRS6. The color scale and the colored contours show the emission tracers labeled in the two panels. Only selected contours are shown for clarity. The four colored lines mark the approximate positions of the emission crests in the corresponding tracers. The sources IRS5, IRS6, and IRS1 are marked. A linear scale bar is shown as well.
Current usage metrics show cumulative count of Article Views (full-text article views including HTML views, PDF and ePub downloads, according to the available data) and Abstracts Views on Vision4Press platform.
Data correspond to usage on the plateform after 2015. The current usage metrics is available 48-96 hours after online publication and is updated daily on week days.
Initial download of the metrics may take a while.