Fig. 10
Download original image
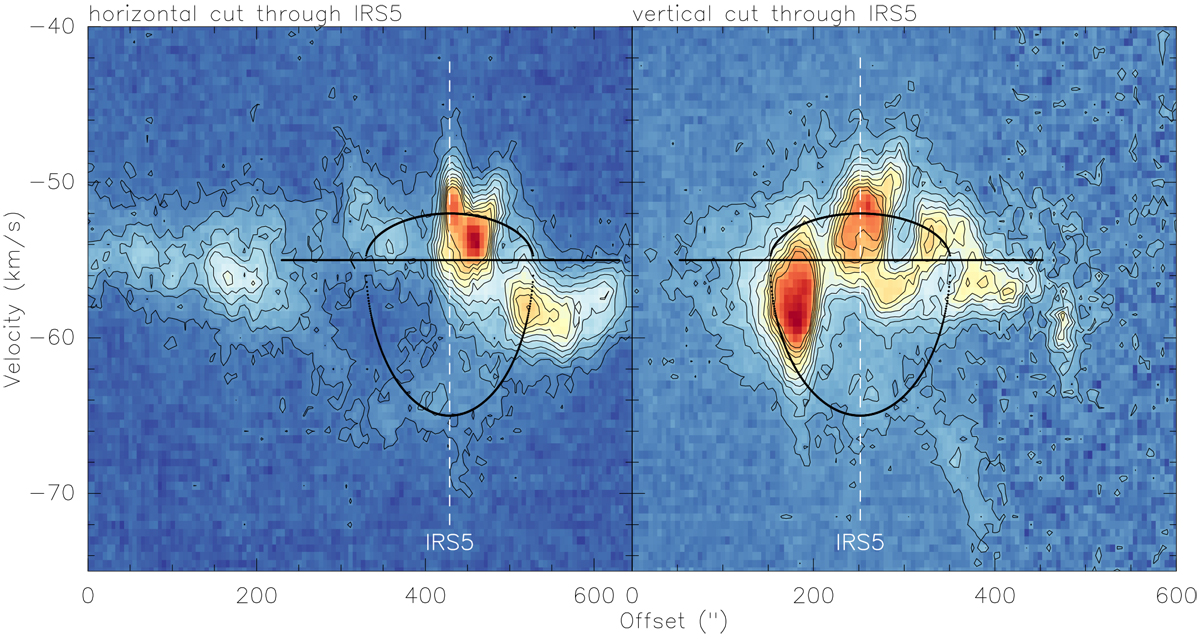
Horizontal (along RA, left) and vertical (along Dec, right) position-velocity diagrams through the position of one of the exciting sources IRS5 (marked in each panel) derived from the [CII] line emission. corresponding roughly to the estimated center of bubble B. The contour levels are in 3σ steps. The black dotted lines outline the elliptical shape a spherical shell would have in the pv diagram – given a radius of 100″ and expansion velocities of 10 and 3 km s−1 at negative and positive relative velocities, respectively.
Current usage metrics show cumulative count of Article Views (full-text article views including HTML views, PDF and ePub downloads, according to the available data) and Abstracts Views on Vision4Press platform.
Data correspond to usage on the plateform after 2015. The current usage metrics is available 48-96 hours after online publication and is updated daily on week days.
Initial download of the metrics may take a while.