Fig. 1
Download original image
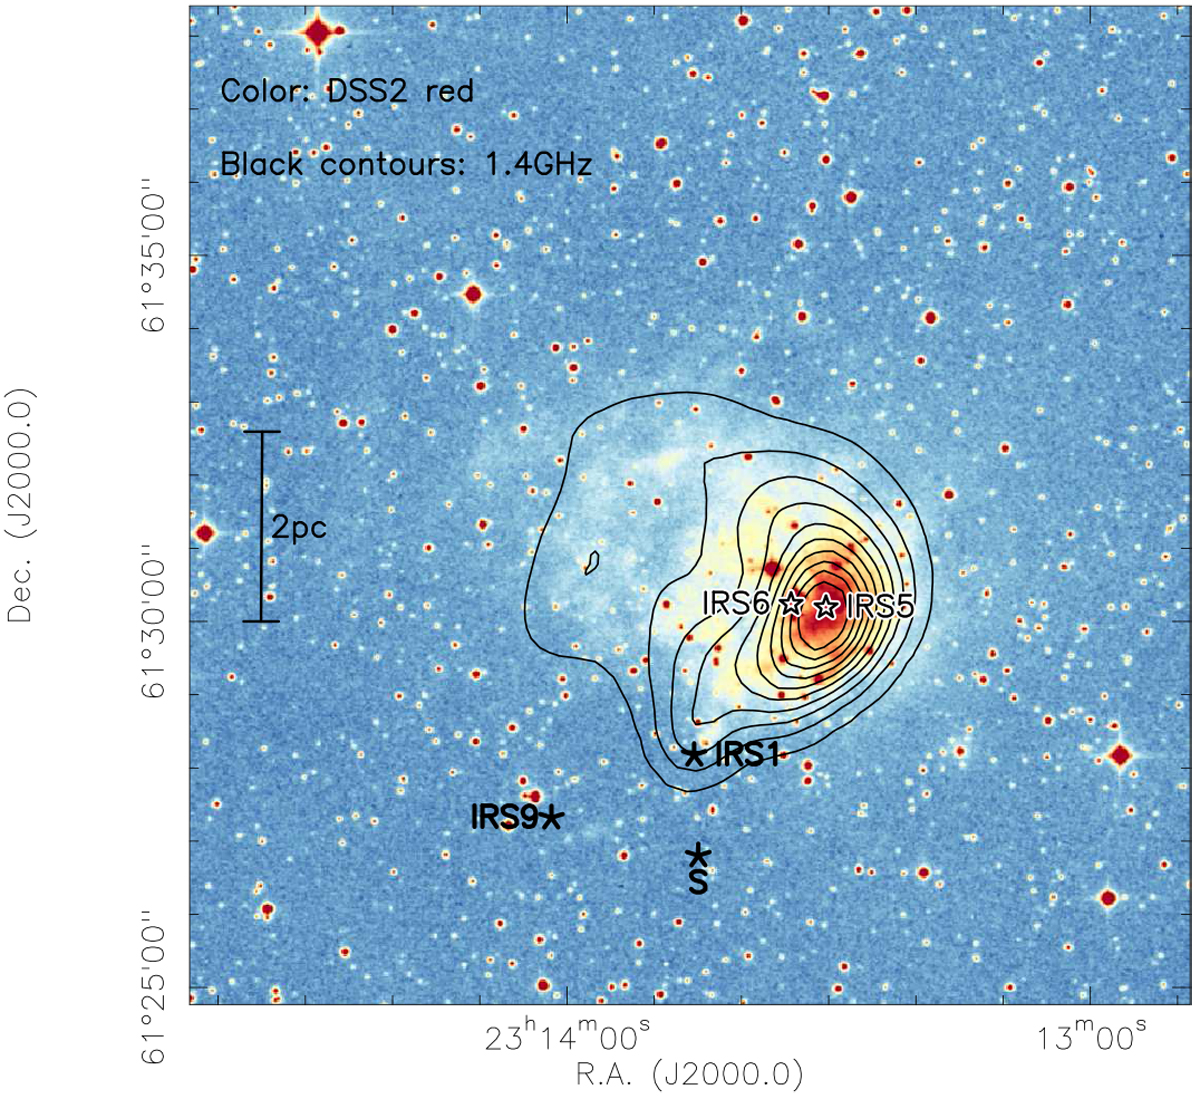
Optical and cm continuum data of the NGC 7538 region, encompassing the field of view of our observations. The color scale shows the optical DSS2 (Digital Sky Survey v2) obtained with the red filter. The contours outline the 1.4 GHz cm continuum emission at 1′ angular resolution from the Canadian Galactic Plane Survey (CGPS, Taylor et al. 2003). The two stars in the center of the H II region mark the positions of IRS5 and IRS6 from Puga et al. (2010). The three five-pointed stars directly below the H II regions show the positions of the active sites of star formation IRS1, S, and IRS9.
Current usage metrics show cumulative count of Article Views (full-text article views including HTML views, PDF and ePub downloads, according to the available data) and Abstracts Views on Vision4Press platform.
Data correspond to usage on the plateform after 2015. The current usage metrics is available 48-96 hours after online publication and is updated daily on week days.
Initial download of the metrics may take a while.