Fig. 6.
Download original image
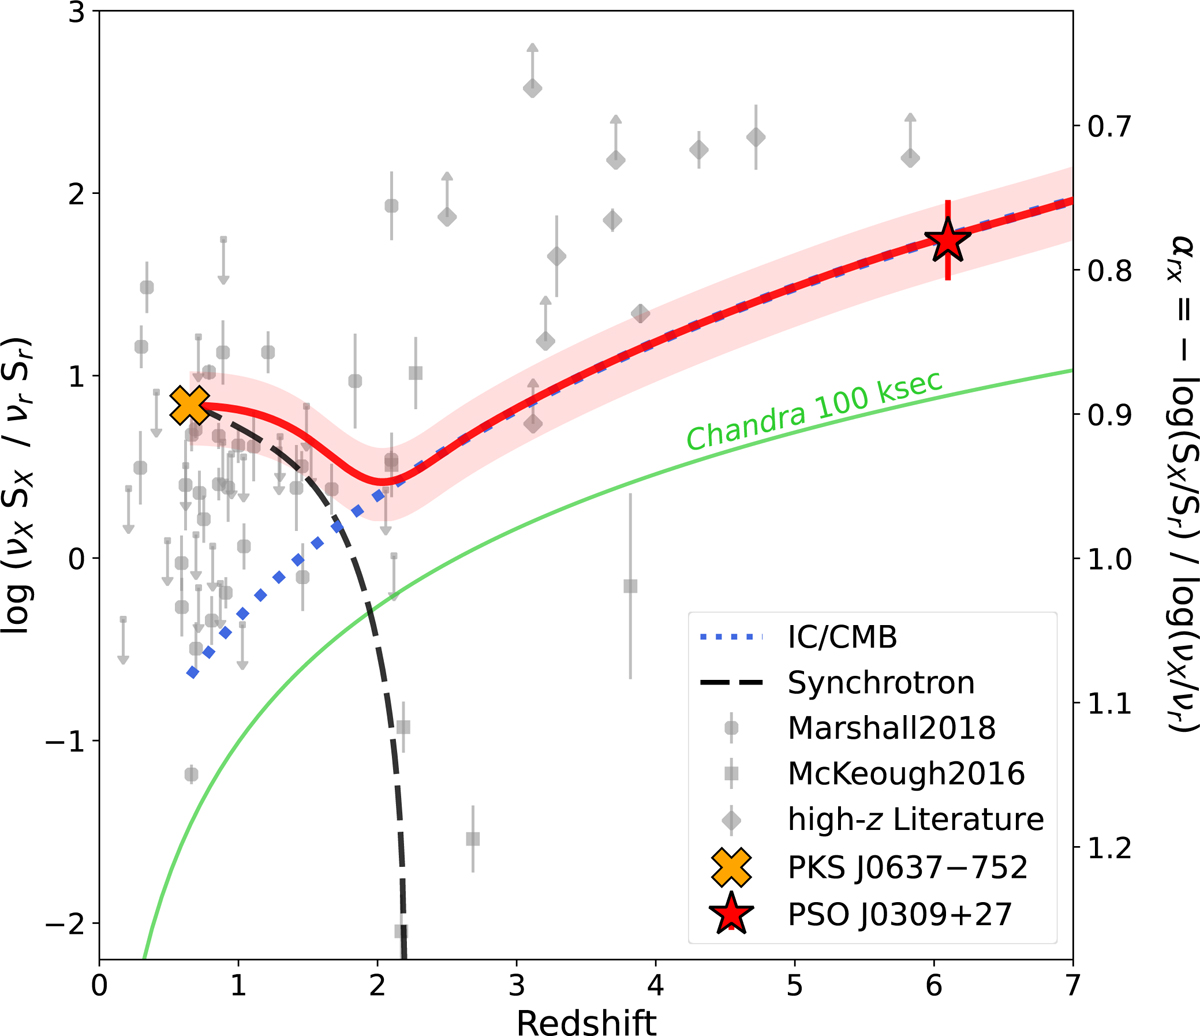
X-ray-to-radio ratios (and αrx) of the extended jets observed by Chandra reported in the literature. The data are from: Marshall et al. (2018), circles at z ≲ 2; McKeough et al. (2016), squares at 2 ≲ z ≲ 4.7 (given by the sum of their ‘detected’ components); Siemiginowska et al. (2003), Cheung et al. (2006), Simionescu et al. (2016), Schwartz et al. (2020), Worrall et al. (2020), Snios et al. (2021); and Connor et al. (2021), diamonds at z ≳ 3. If the same object is reported in more than one work, we consider the most recent. PSO J0309+27 (z = 6.1) is represented by a red star and PKS J0637−752 (z = 0.65) by an orange cross. The solid red line connecting the two sources is the evolution of the X-ray-to-radio ratio as a function of redshift based on the model reported in Fig. 5, where the extended X-ray emission is given by the sum of a synchrotron (dashed black line) and an IC/CMB component (dotted blue line). The solid green line represents the limit above which an extended X-ray jet with the same radio luminosity as the one found in PSO J0309+27 can be observed with a 100 ksec Chandra exposure.
Current usage metrics show cumulative count of Article Views (full-text article views including HTML views, PDF and ePub downloads, according to the available data) and Abstracts Views on Vision4Press platform.
Data correspond to usage on the plateform after 2015. The current usage metrics is available 48-96 hours after online publication and is updated daily on week days.
Initial download of the metrics may take a while.