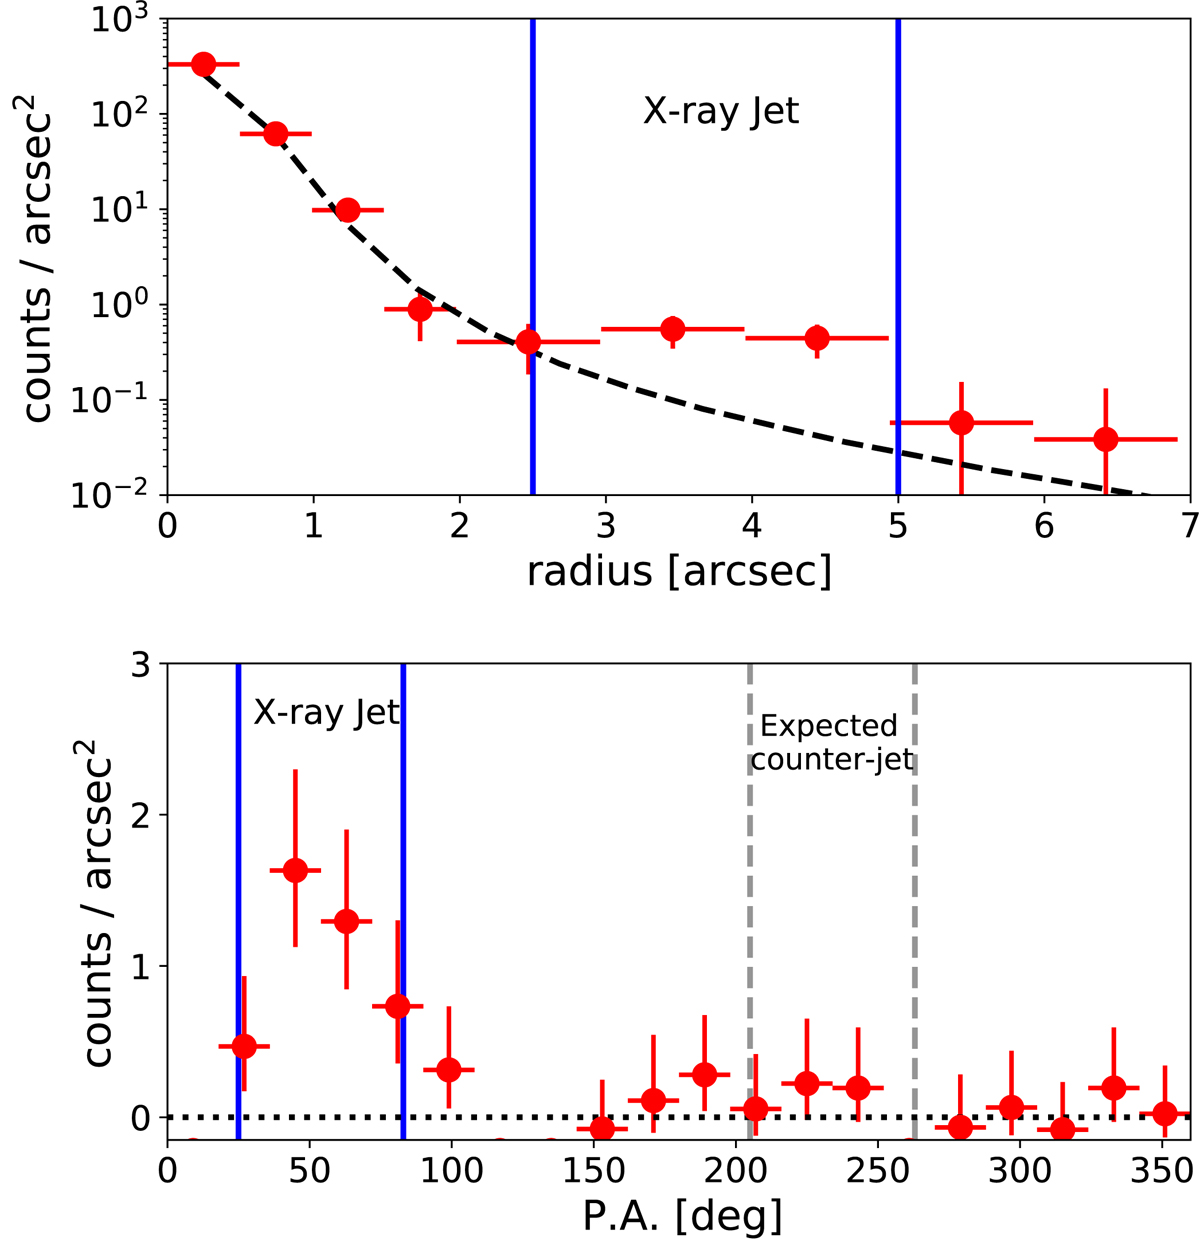
Fig. 3.
Download original image
Observed radial (top) and angular (bottom) profiles of PSO J0309+27 in the 0.5–7 keV energy band. In both cases the background has been subtracted and data points have Poissonian uncertainties. The dashed black line in the top panel is the expected PSF of the observation, computed with MARX. The vertical blue lines delimit the extraction region considered for the spectral analysis of the jet, and the area delimited by the grey lines is where the counter-jet is expected (see Sect. 2.3.2). The direction of the PA in the lower panel is east of north.
Current usage metrics show cumulative count of Article Views (full-text article views including HTML views, PDF and ePub downloads, according to the available data) and Abstracts Views on Vision4Press platform.
Data correspond to usage on the plateform after 2015. The current usage metrics is available 48-96 hours after online publication and is updated daily on week days.
Initial download of the metrics may take a while.