Fig. 2.
Download original image
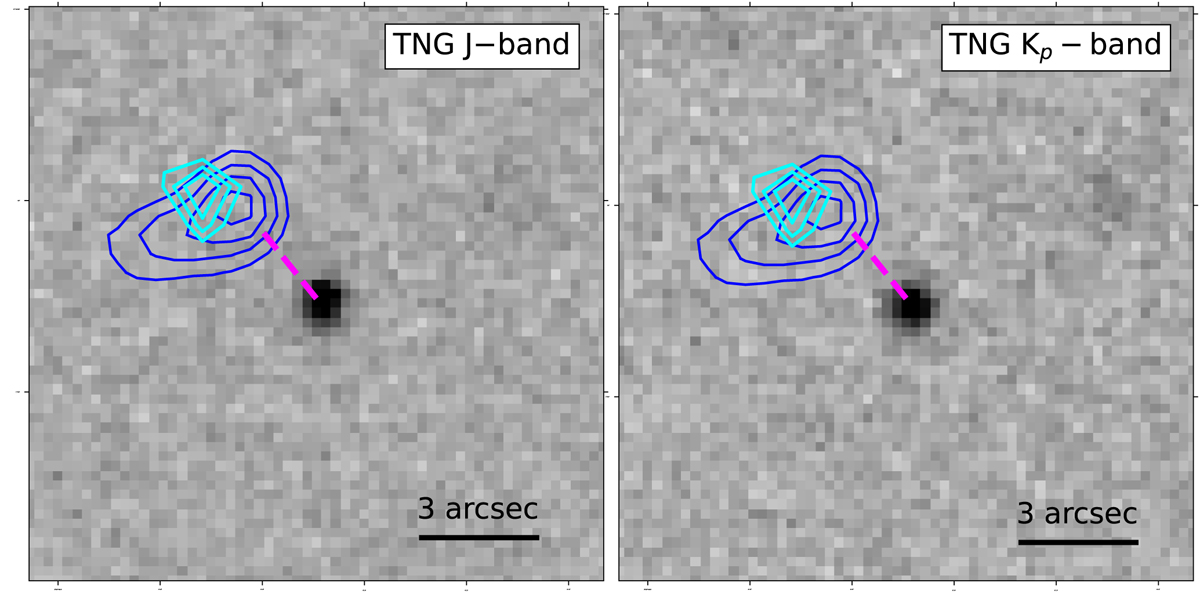
J- and Kp-band images of PSO J0309+27 obtained with the TNG. The contours of the smoothed Chandra X-ray image, with the core’s region subtracted, are shown in blue; the contours from the residual VLASS image (i.e. with the core’s emission subtracted) are displayed in cyan. The contour levels have been arbitrarily chosen to best show the jet and are always greater than three times the RMS of the given image. The dashed magenta line indicates the direction of the ∼500 pc radio jet described in Spingola et al. (2020).
Current usage metrics show cumulative count of Article Views (full-text article views including HTML views, PDF and ePub downloads, according to the available data) and Abstracts Views on Vision4Press platform.
Data correspond to usage on the plateform after 2015. The current usage metrics is available 48-96 hours after online publication and is updated daily on week days.
Initial download of the metrics may take a while.