Fig. 1.
Download original image
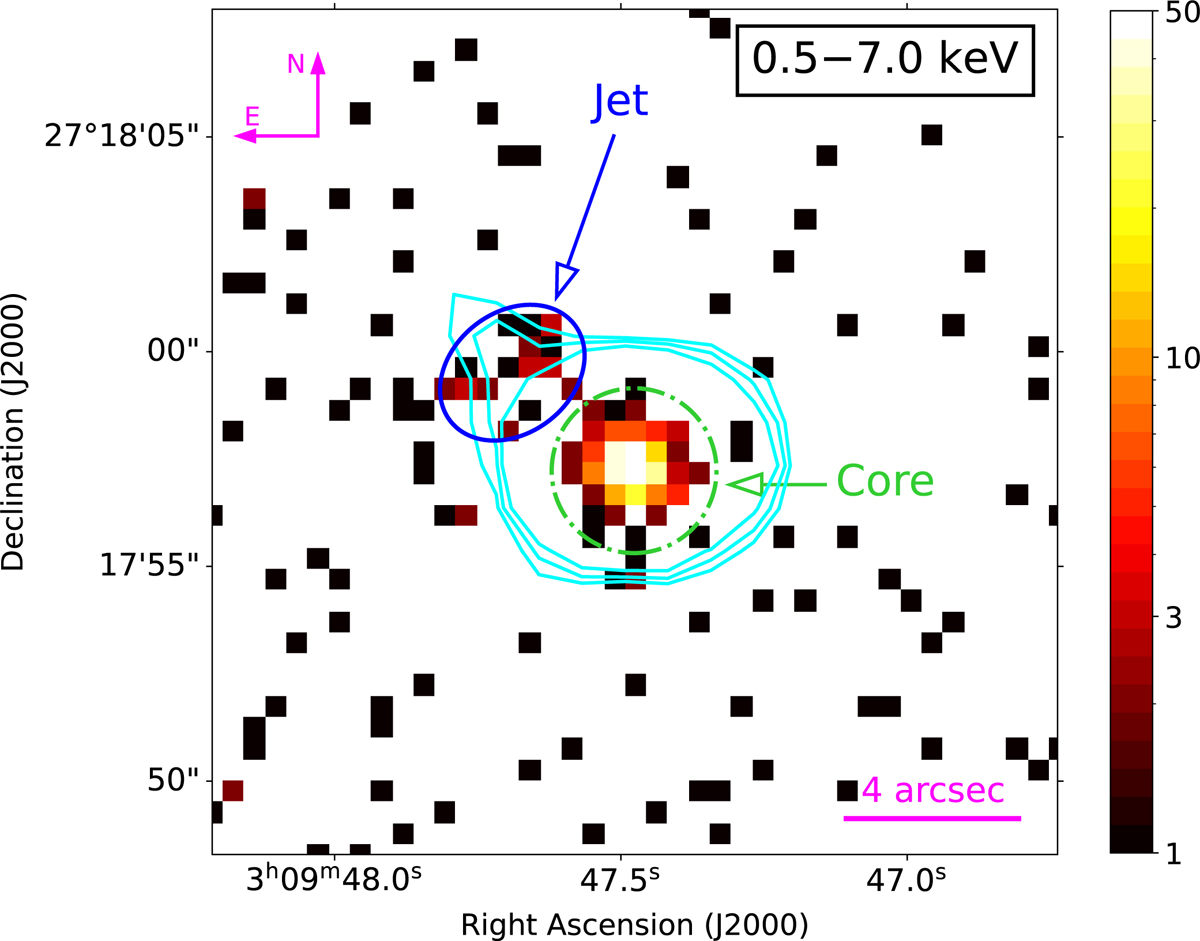
3 GHz radio contours from the VLASS survey (in cyan) overlaid on the 0.5–7 keV X-ray image of PSO J0309+27 from the 128 ksec Chandra observation. The count colour scale is displayed on the right. For display purposes, only the (3, 3![]() , 6) × the off-source RMS (=0.12 mJy beam−1) radio contours are reported. The dashed green circle and the solid blue ellipse are the regions used for the extraction of the core and the jet X-ray spectra, respectively.
, 6) × the off-source RMS (=0.12 mJy beam−1) radio contours are reported. The dashed green circle and the solid blue ellipse are the regions used for the extraction of the core and the jet X-ray spectra, respectively.
Current usage metrics show cumulative count of Article Views (full-text article views including HTML views, PDF and ePub downloads, according to the available data) and Abstracts Views on Vision4Press platform.
Data correspond to usage on the plateform after 2015. The current usage metrics is available 48-96 hours after online publication and is updated daily on week days.
Initial download of the metrics may take a while.