Fig. 4.
Download original image
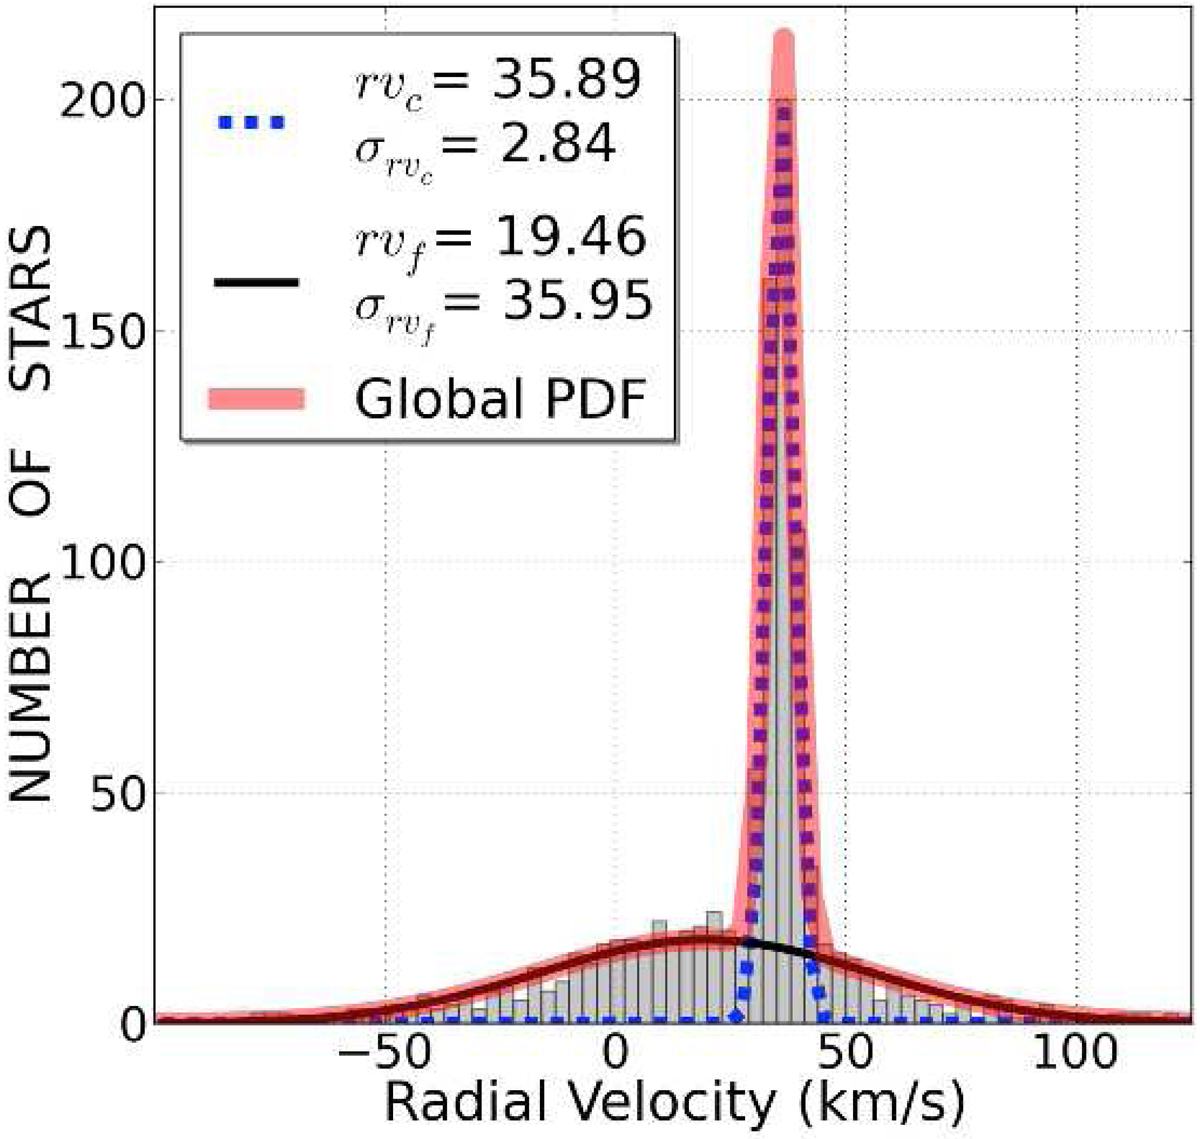
Distribution of the RVs of the 1028 stars observed with GIRAFFE in NGC 6705. The solid black line and the dashed blue line represent the field stars and cluster members radial velocity distributions. The probability density function (labelled PDF) of the total sample is plotted in red. As can be observed, a mean value of 35.89 km s−1 is found for the RV of the cluster members, with a standard deviation of 2.84 km s−1. For the field stars, the mean RV is 19.46 km s−1 and the standard deviation 35.95 km s−1.
Current usage metrics show cumulative count of Article Views (full-text article views including HTML views, PDF and ePub downloads, according to the available data) and Abstracts Views on Vision4Press platform.
Data correspond to usage on the plateform after 2015. The current usage metrics is available 48-96 hours after online publication and is updated daily on week days.
Initial download of the metrics may take a while.