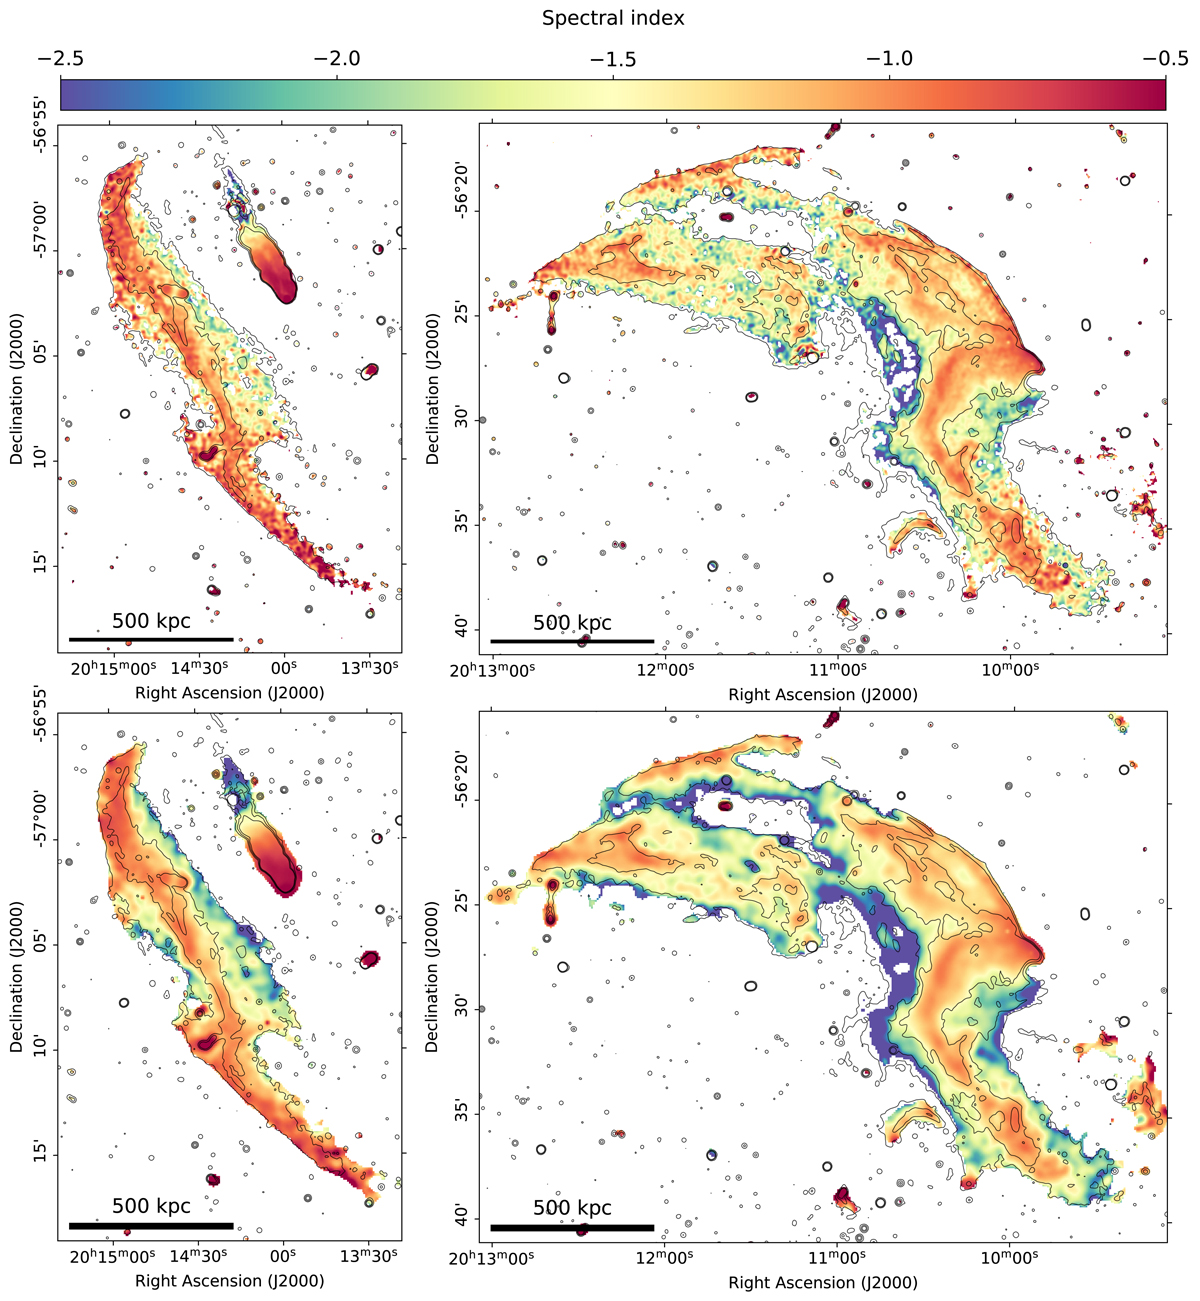
Fig. 8.
Download original image
Spectral index maps of the radio relic regions. Top panels: spectral index maps derived from the high-resolution image set (beam: 12″ × 12″). Bottom panels: spectral index maps derived from the low-resolution image set (beam: 26″ × 26″). Corresponding error maps are shown in Fig. B.1. In all panels, contours are taken from the flat-noise map at (7, 25, 60)×σ with σ = 6.3 μJy beam−1 and beam 10″ × 10″.
Current usage metrics show cumulative count of Article Views (full-text article views including HTML views, PDF and ePub downloads, according to the available data) and Abstracts Views on Vision4Press platform.
Data correspond to usage on the plateform after 2015. The current usage metrics is available 48-96 hours after online publication and is updated daily on week days.
Initial download of the metrics may take a while.