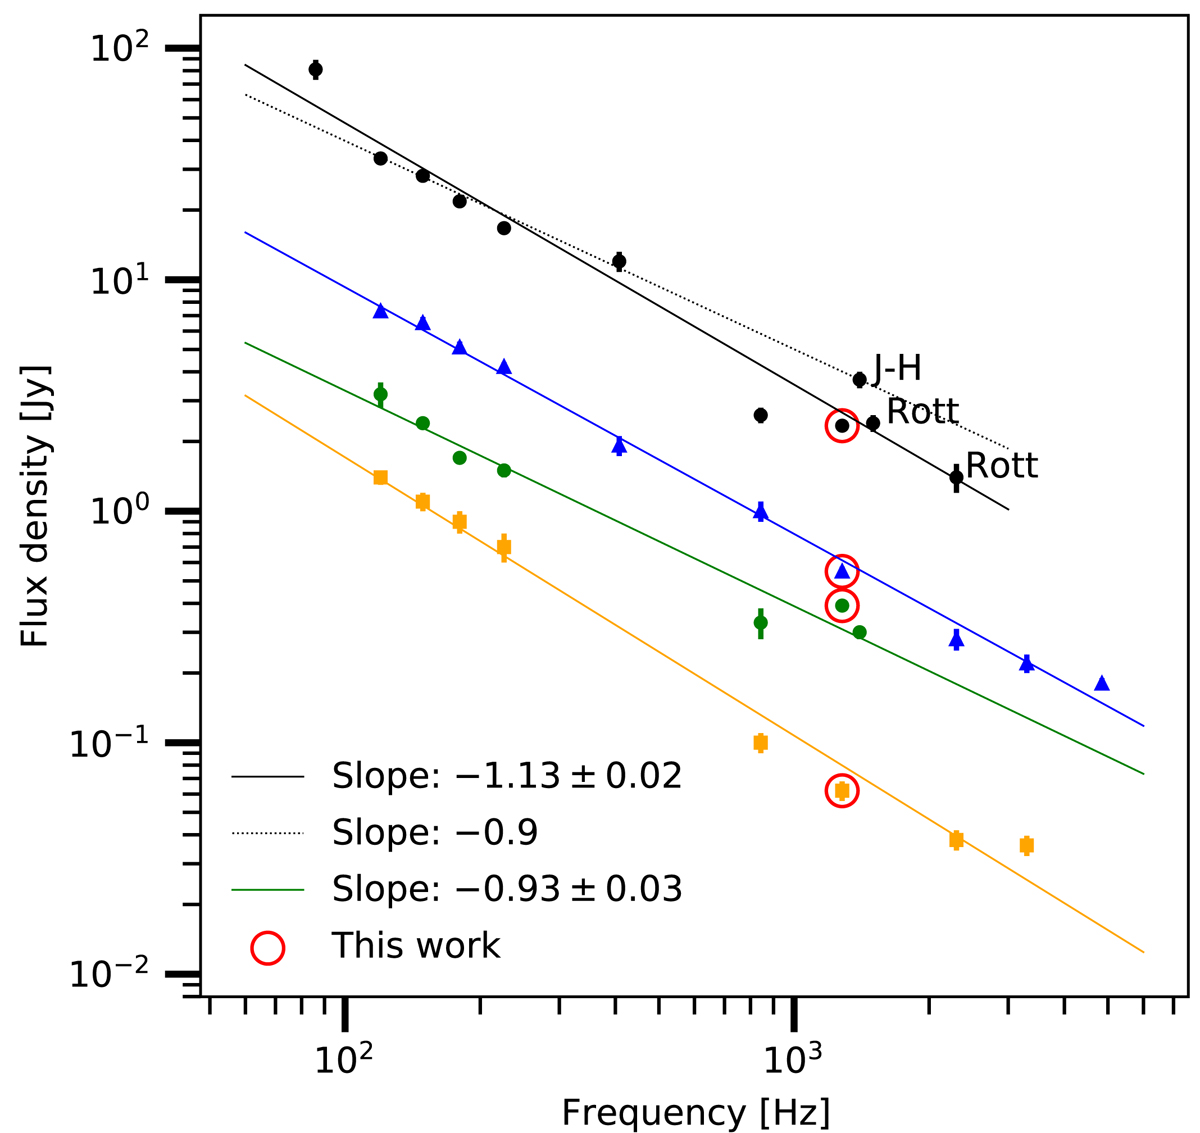
Fig. 7.
Download original image
Spectral energy distribution of four sources in the field. From top to bottom: NW radio relic (black), RG1 (blue), the SE radio relic (green), and ‘Source C’ from Hindson et al. (2014), located close to the Notch (yellow). Flux densities from lower to higher frequencies are taken from Mills et al. (1961), Bolton et al. (1964), Large et al. (1991), Hindson et al. (2014), Johnston-Hollitt (2003), Röttgering et al. (1997), Carretti et al. (2013), and Wright et al. (1994). Solid lines are linear regressions.
Current usage metrics show cumulative count of Article Views (full-text article views including HTML views, PDF and ePub downloads, according to the available data) and Abstracts Views on Vision4Press platform.
Data correspond to usage on the plateform after 2015. The current usage metrics is available 48-96 hours after online publication and is updated daily on week days.
Initial download of the metrics may take a while.