Fig. 26.
Download original image
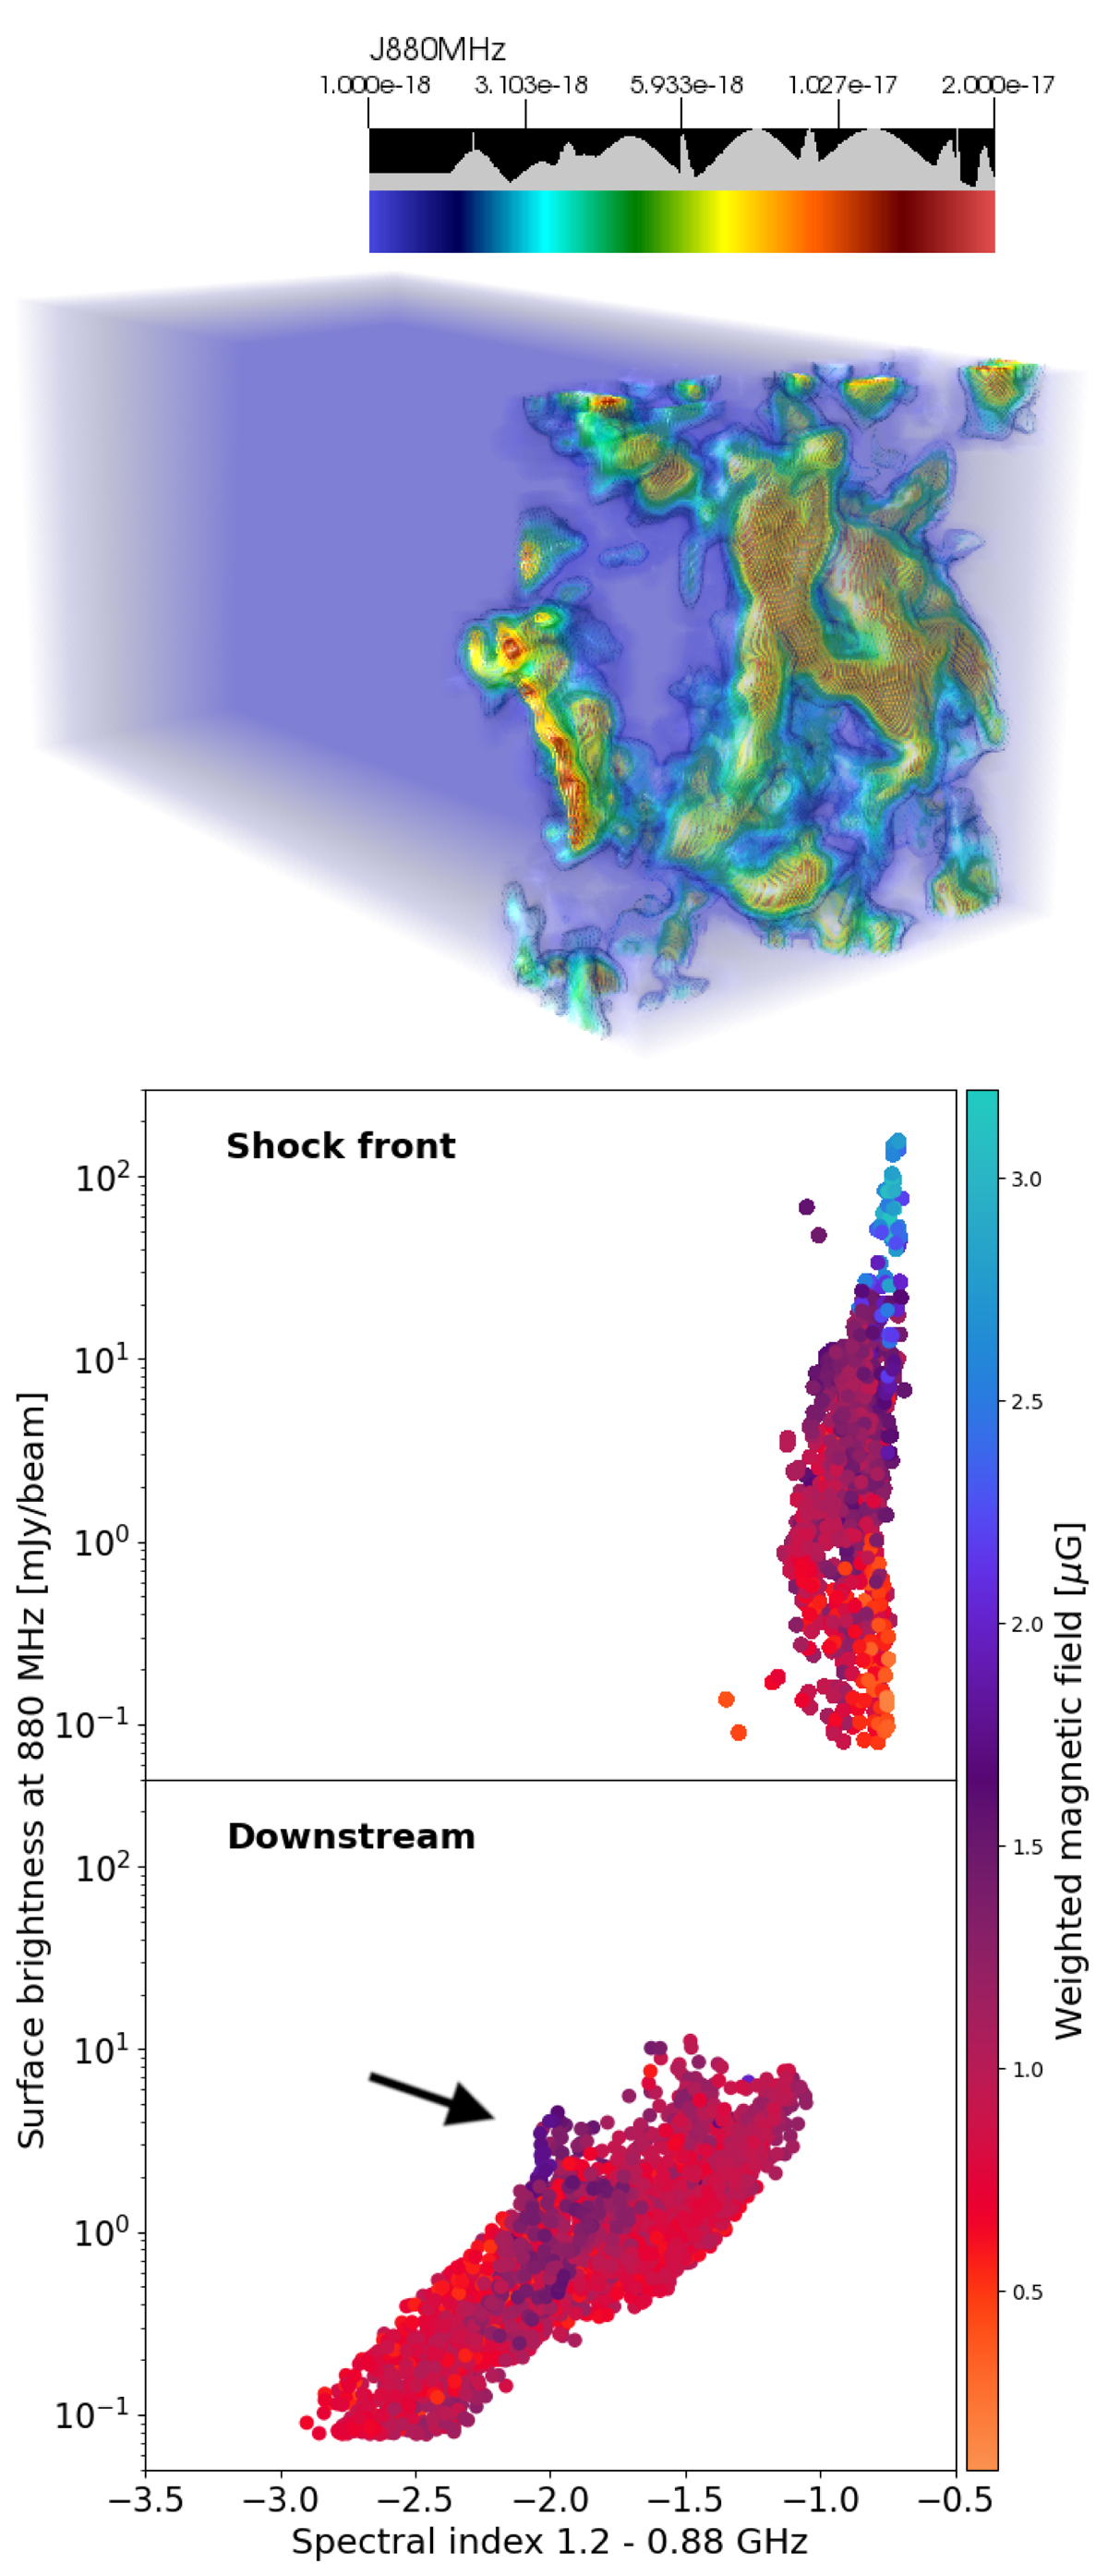
Results from Hybrid MHD-Lagrangian simulations. Top panel: visualisation of synchrotron emissivity at 880 MHz (in code units). Bottom panels: phase plot of the spectral index computed between 880 MHz and 1.2 GHz versus surface brightness at 880 MHz. We show the values at selected pixels in the surface brightness maps. Upper (lower) panel: values corresponding to the shock front (downstream) region. We obtain magnetic field maps by projecting the 3D magnetic field using the 880 MHz emissivity as a weight, and finally, we colour-code each point in the plot with its corresponding weighted magnetic field value. The arrow shows a group of brighter particles associated with stronger magnetic fields. See Fig. 27 for a comparison with real data.
Current usage metrics show cumulative count of Article Views (full-text article views including HTML views, PDF and ePub downloads, according to the available data) and Abstracts Views on Vision4Press platform.
Data correspond to usage on the plateform after 2015. The current usage metrics is available 48-96 hours after online publication and is updated daily on week days.
Initial download of the metrics may take a while.