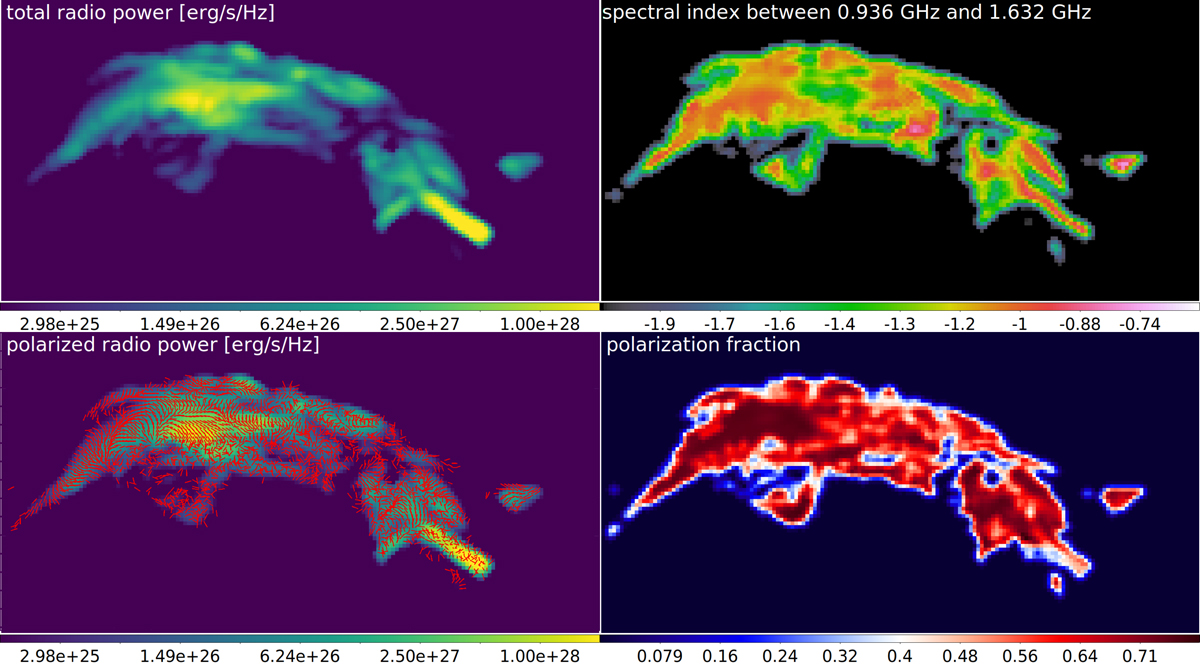
Fig. 22.
Download original image
Maps of the simulated relic. Top left: radio power at 1.4 GHz. Top right: spectral index measured between 4.85 GHz and 140 MHz. Bottom left: polarised radio power at 1.4 GHz overplotted with the magnetic field angle (B vectors). Bottom right: polarisation fraction at 1.4 GHz. In each map, the resolution is (12.6292 kpc)2 per pixel, which corresponds to 13.5″ at the distance of Abell 3667. Each map was smoothed with a Gaussian of size σ = 27″.
Current usage metrics show cumulative count of Article Views (full-text article views including HTML views, PDF and ePub downloads, according to the available data) and Abstracts Views on Vision4Press platform.
Data correspond to usage on the plateform after 2015. The current usage metrics is available 48-96 hours after online publication and is updated daily on week days.
Initial download of the metrics may take a while.