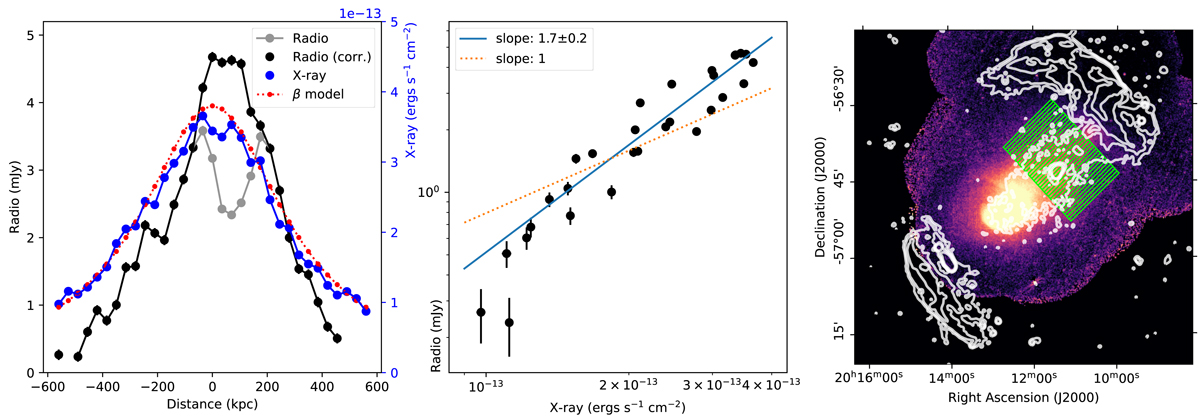
Fig. 21.
Download original image
Analysis of the linear radio halo. Left panel: radial profile of the X-ray intensity (blue) and the β model described in the text. The radio profile with the pixels belonging to the bright radio galaxy (RG1) blanked is shown in grey. We corrected for the missing pixels assuming their value to be equal to the mean of the other pixels in the same region (shown in black). Central panel: X-ray–radio intensity relation with an orthogonal distance regression linear fit (solid line) that includes error on both variables. Right panel: green, the regions used to evaluate the profile (background and contours are the same as in Fig. 4).
Current usage metrics show cumulative count of Article Views (full-text article views including HTML views, PDF and ePub downloads, according to the available data) and Abstracts Views on Vision4Press platform.
Data correspond to usage on the plateform after 2015. The current usage metrics is available 48-96 hours after online publication and is updated daily on week days.
Initial download of the metrics may take a while.