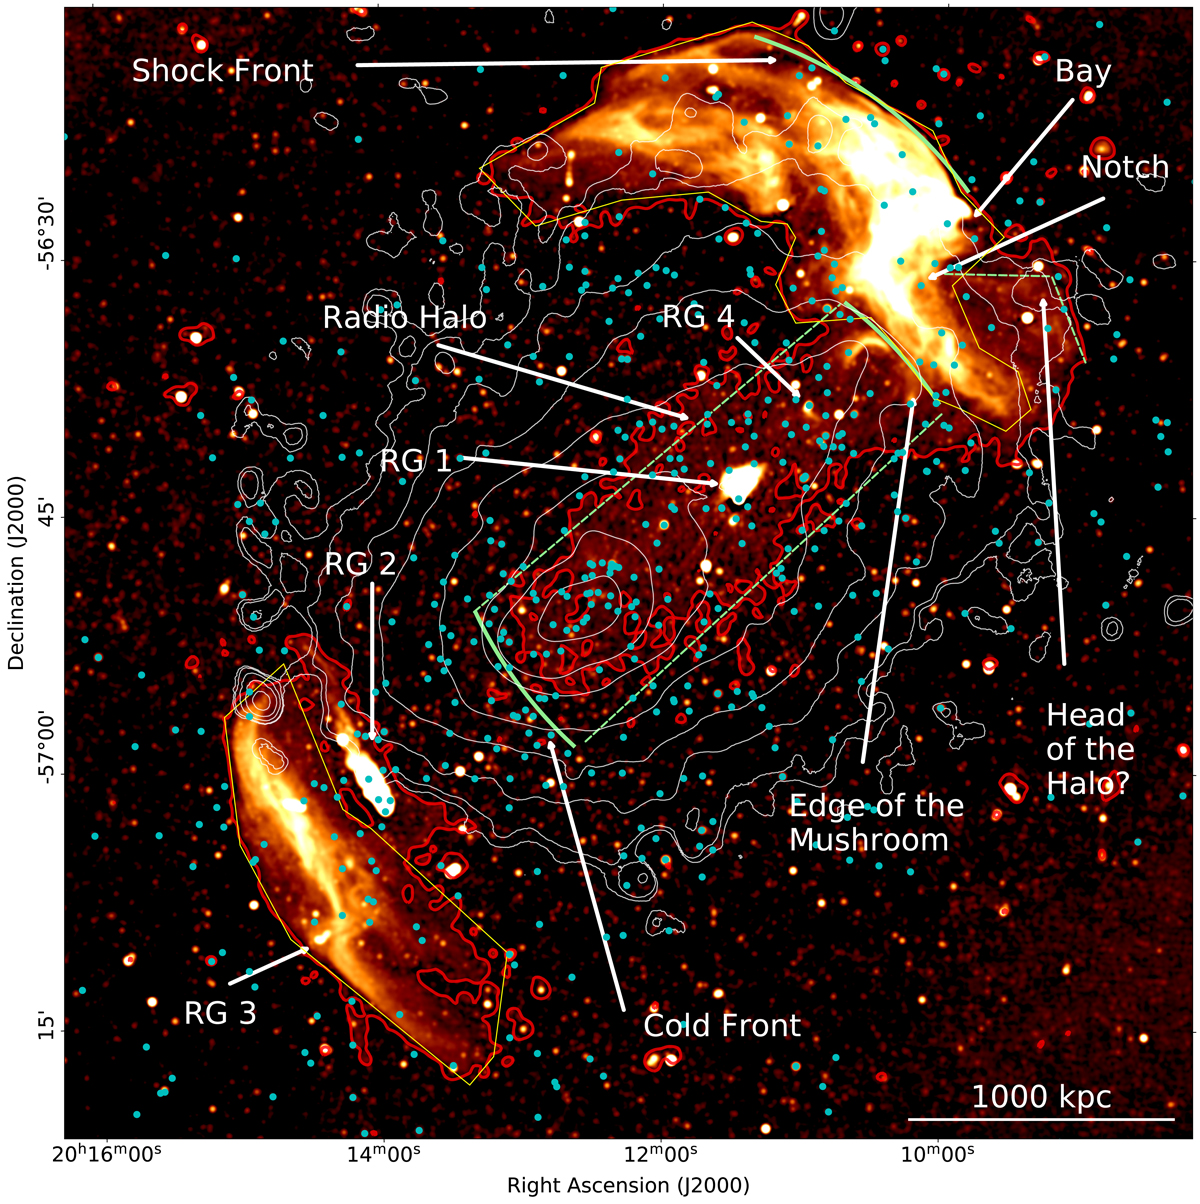
Fig. 2.
Download original image
Flat-noise image of the cluster region with some features and sources labelled. Solid green lines trace the location of known X-ray discontinuities. Dashed green lines show the region occupied by the radio halo and its possible starting point. The red contour traces the 5σ level in the low-resolution map (σ = 17 μJy beam−1, with beam: 35″ × 35″). White contours trace the X-ray emission from XMM-Newton. Light blue dots mark the positions of spectroscopically identified cluster members from Owers et al. (2009). The yellow lines show the region used to extract the integrated flux density of the radio relics.
Current usage metrics show cumulative count of Article Views (full-text article views including HTML views, PDF and ePub downloads, according to the available data) and Abstracts Views on Vision4Press platform.
Data correspond to usage on the plateform after 2015. The current usage metrics is available 48-96 hours after online publication and is updated daily on week days.
Initial download of the metrics may take a while.