Fig. 16.
Download original image
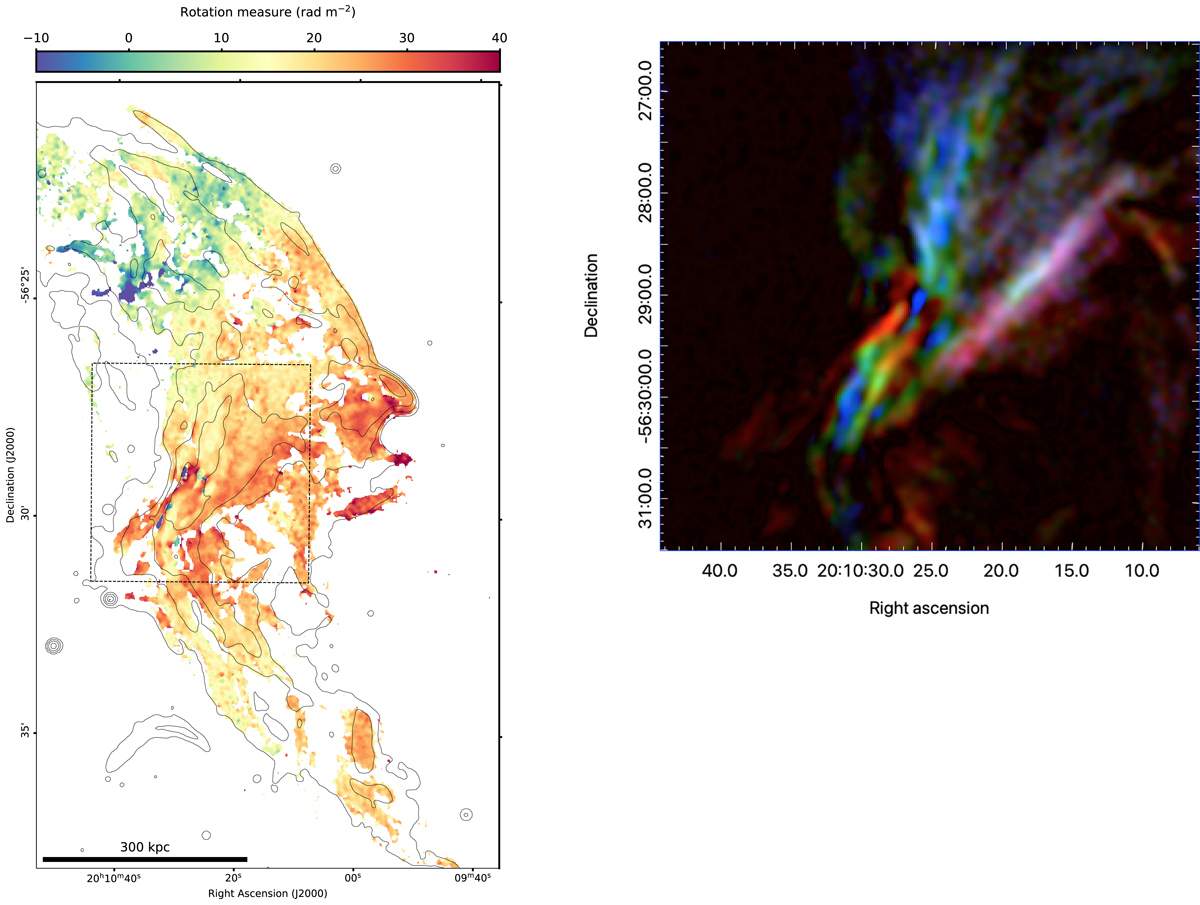
Rotation measure of the filaments. Left: high spatial resolution (7.4″ × 7.3″) RM map. The local Galactic Faraday rotation has been subtracted (ϕ = 39.5 rad m−2). Black contours are the same as in Fig. 8 but at levels (20, 50, 100, 200)×σ. Right: more detailed look at the Faraday depth structure within the box of the left panel, using three planes from the deconvolved Faraday depth cube. After subtracting a Galactic contribution of 39.5 rad m−2, the respective Faraday depths were red = 8.5, green = 20.5, and blue = 32.5 rad m−2. There is sometimes emission at more than one Faraday depth at the same location, producing other colours, but they do not correspond to a single Faraday depth (or RM).
Current usage metrics show cumulative count of Article Views (full-text article views including HTML views, PDF and ePub downloads, according to the available data) and Abstracts Views on Vision4Press platform.
Data correspond to usage on the plateform after 2015. The current usage metrics is available 48-96 hours after online publication and is updated daily on week days.
Initial download of the metrics may take a while.