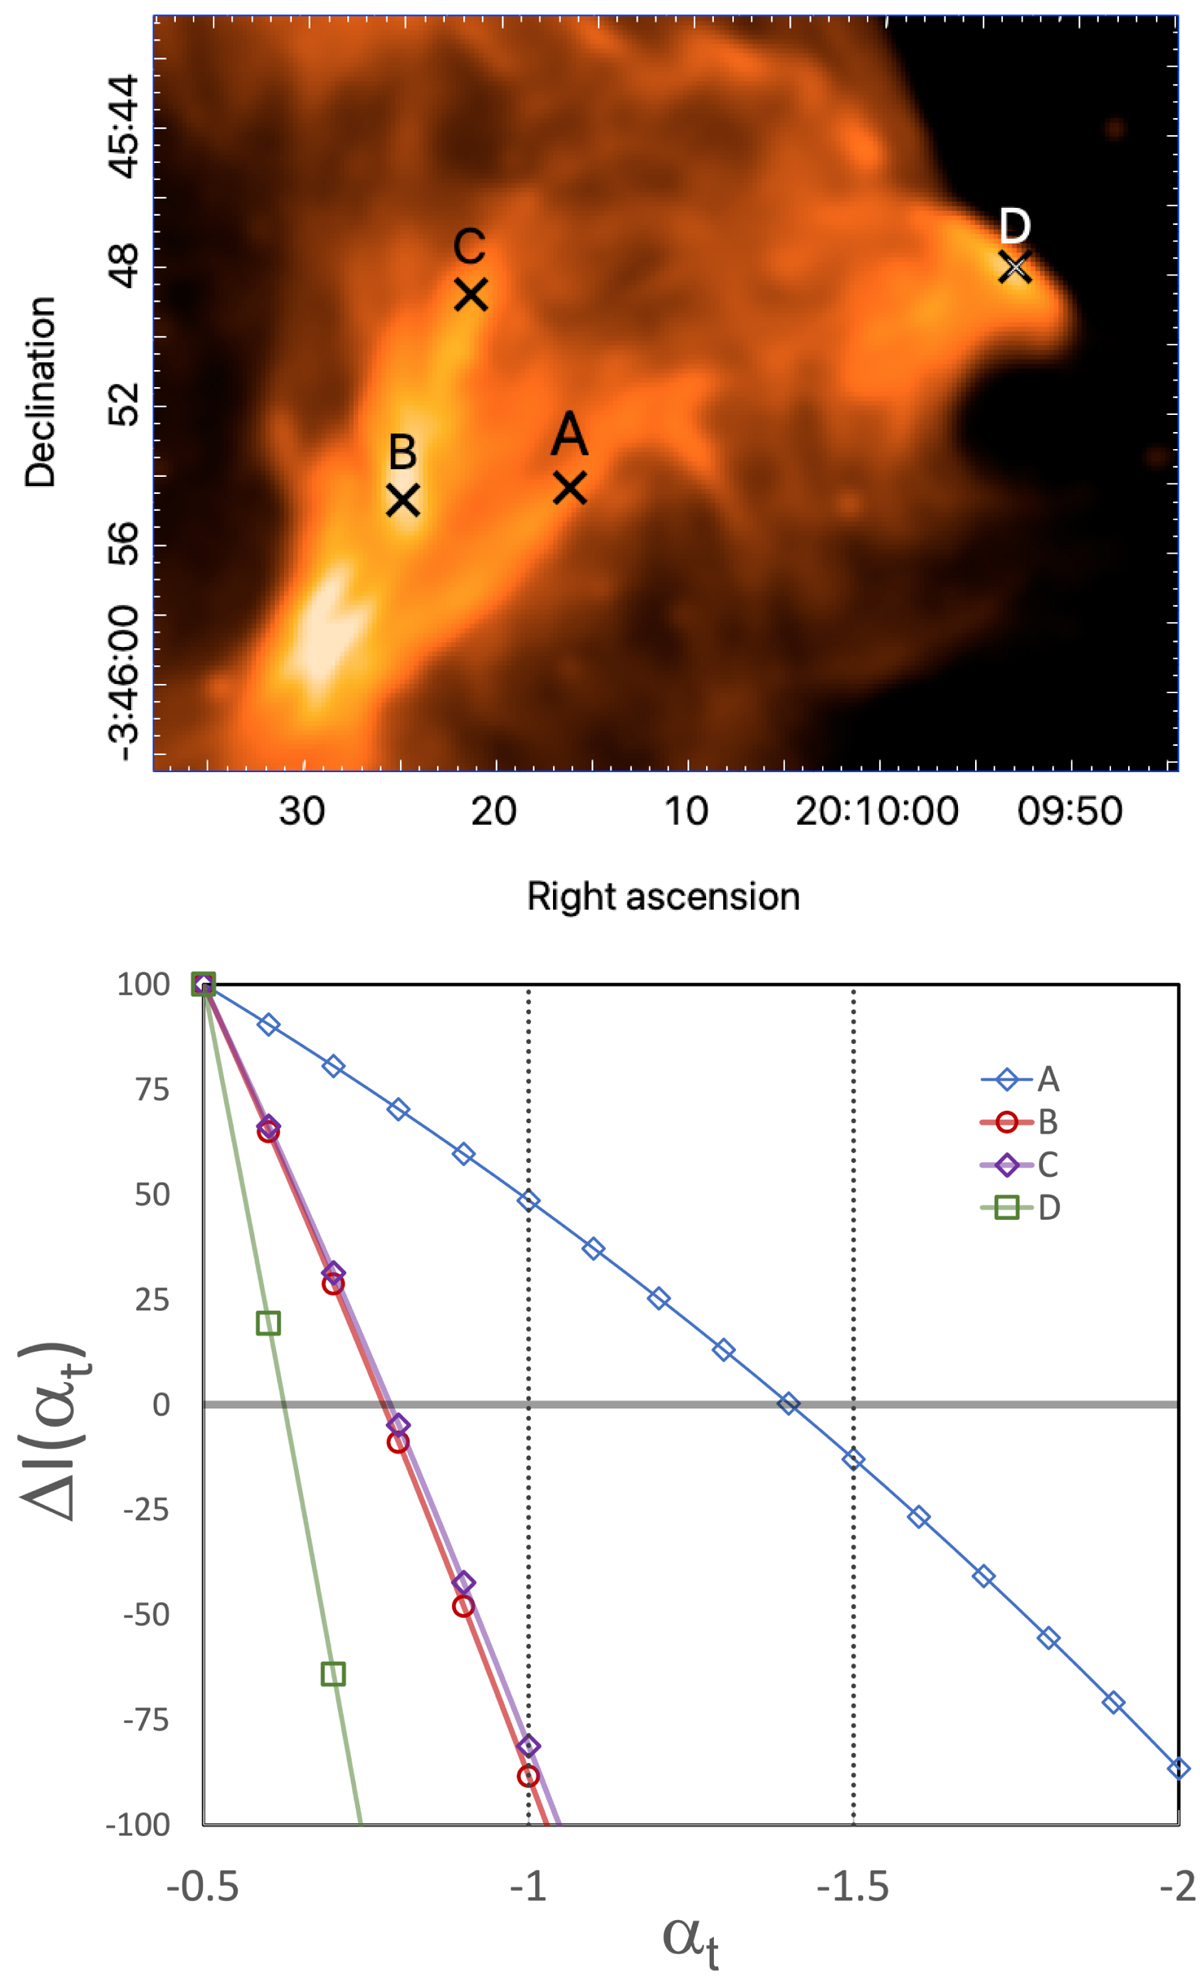
Fig. 15.
Download original image
Spectral index of the filaments. Top panel: positions for isolating filament spectra. Bottom panel: background-subtracted flux for filaments as a function of tomographic spectral index. The brightnesses are all normalised to 100 at αt = −0.5. The zero crossing points indicate the respective filament spectral indices when they disappear against the local background.
Current usage metrics show cumulative count of Article Views (full-text article views including HTML views, PDF and ePub downloads, according to the available data) and Abstracts Views on Vision4Press platform.
Data correspond to usage on the plateform after 2015. The current usage metrics is available 48-96 hours after online publication and is updated daily on week days.
Initial download of the metrics may take a while.