Fig. 1.
Download original image
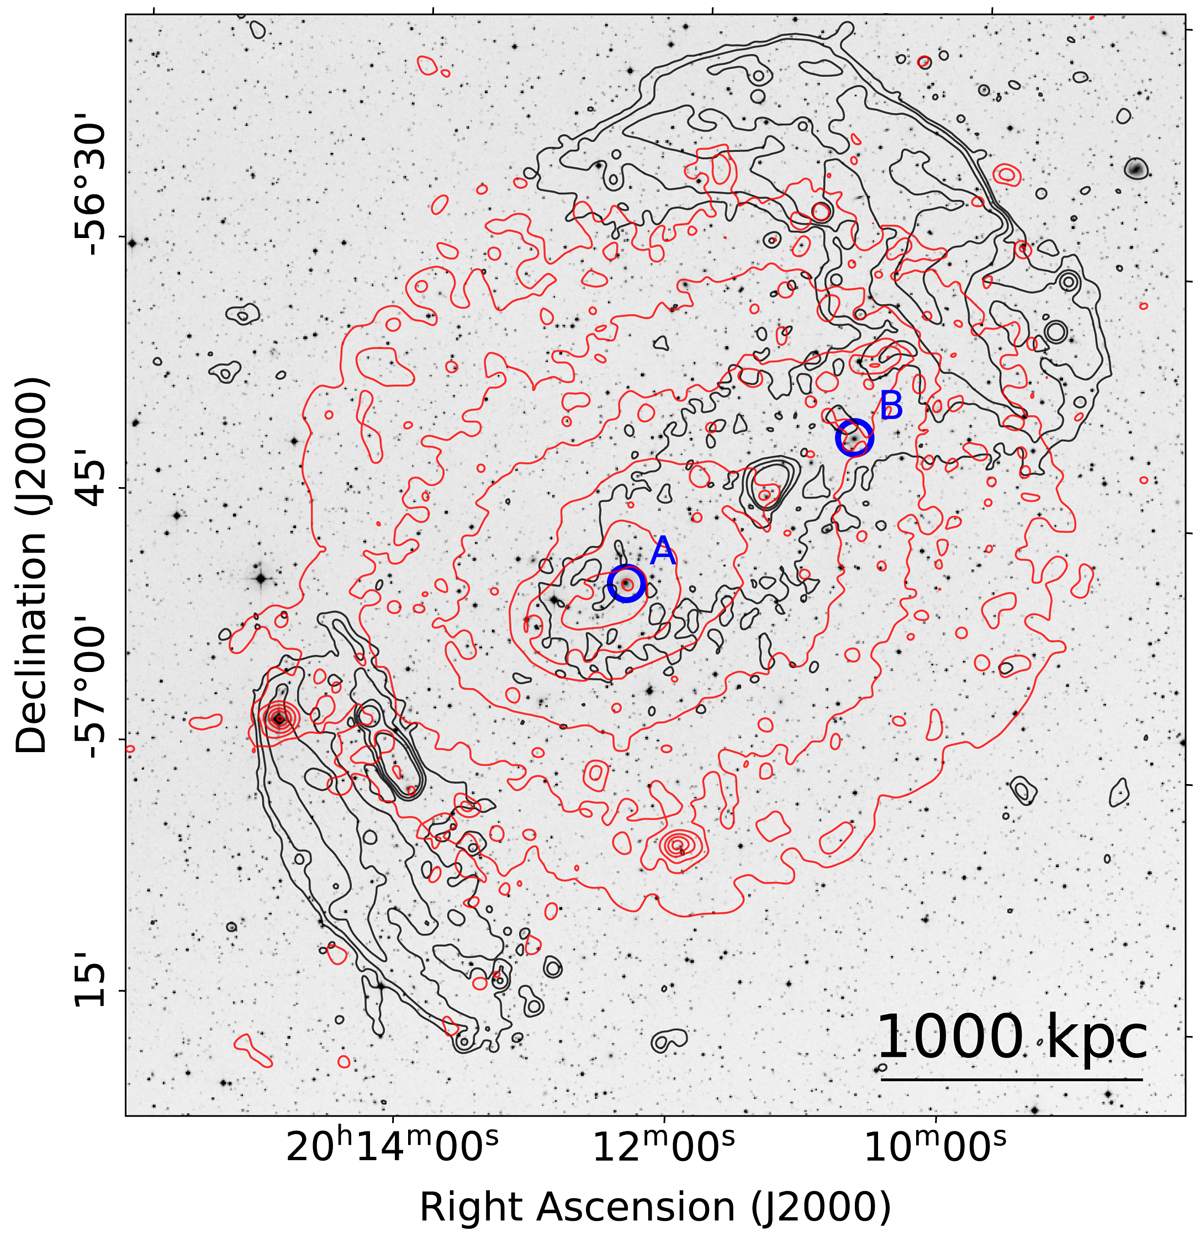
Digital Sky Survey r-band image with contours from radio emission in black and from X-ray emission in red. The brightest cluster galaxies (BCG) of the two main sub-clusters are circled in blue and labelled A and B. Contours are taken from the flat-noise map and trace the source-subtracted low-resolution MeerKAT data at (5, 20, 80, 320)×σ with σ = 17 μJy beam−1 and beam 35″ × 35″.
Current usage metrics show cumulative count of Article Views (full-text article views including HTML views, PDF and ePub downloads, according to the available data) and Abstracts Views on Vision4Press platform.
Data correspond to usage on the plateform after 2015. The current usage metrics is available 48-96 hours after online publication and is updated daily on week days.
Initial download of the metrics may take a while.