Fig. 8.
Download original image
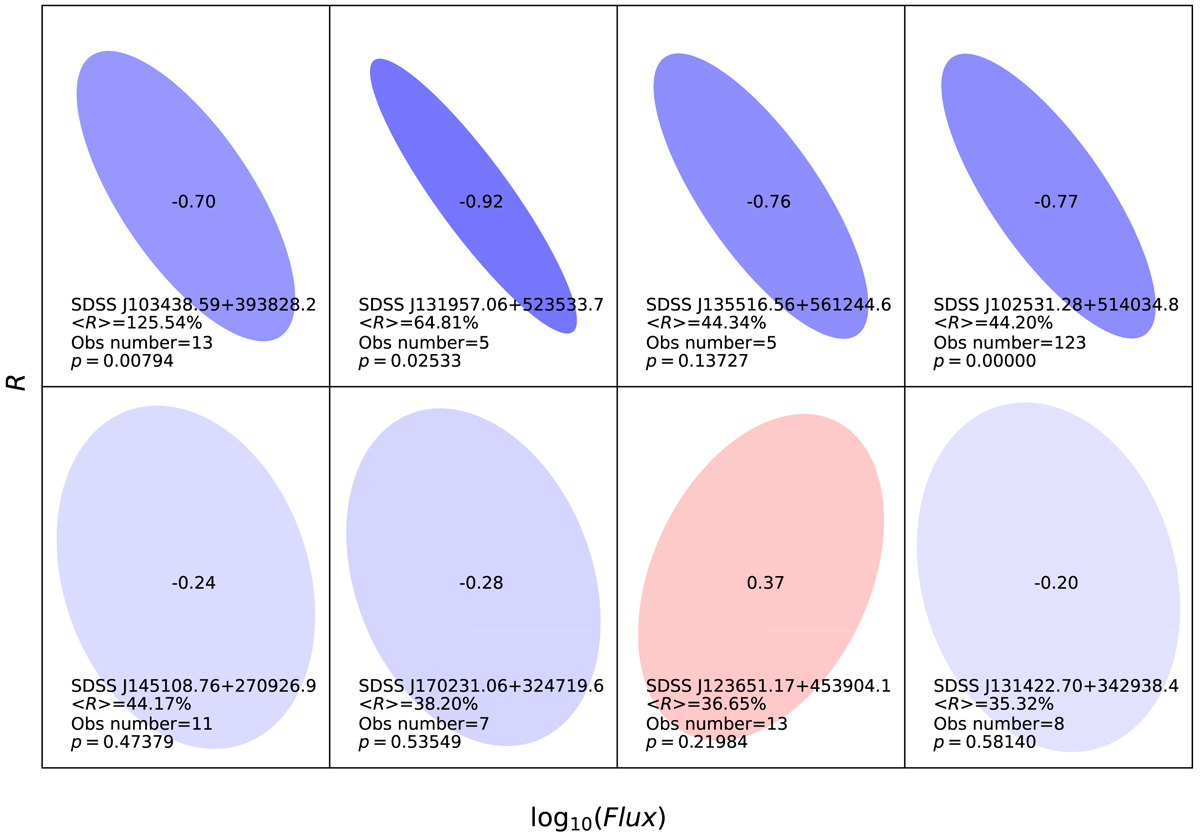
Correlation diagrams of the power-law flux (F) and the relative strength of soft X-ray excess (R) under different flux states for sources where significant soft X-ray excess (soft excess relative strength higher than 30%) was detected in the average state. These sources are displayed in descending order according to their soft excess relative strength under the average state.
Current usage metrics show cumulative count of Article Views (full-text article views including HTML views, PDF and ePub downloads, according to the available data) and Abstracts Views on Vision4Press platform.
Data correspond to usage on the plateform after 2015. The current usage metrics is available 48-96 hours after online publication and is updated daily on week days.
Initial download of the metrics may take a while.