Fig. 7.
Download original image
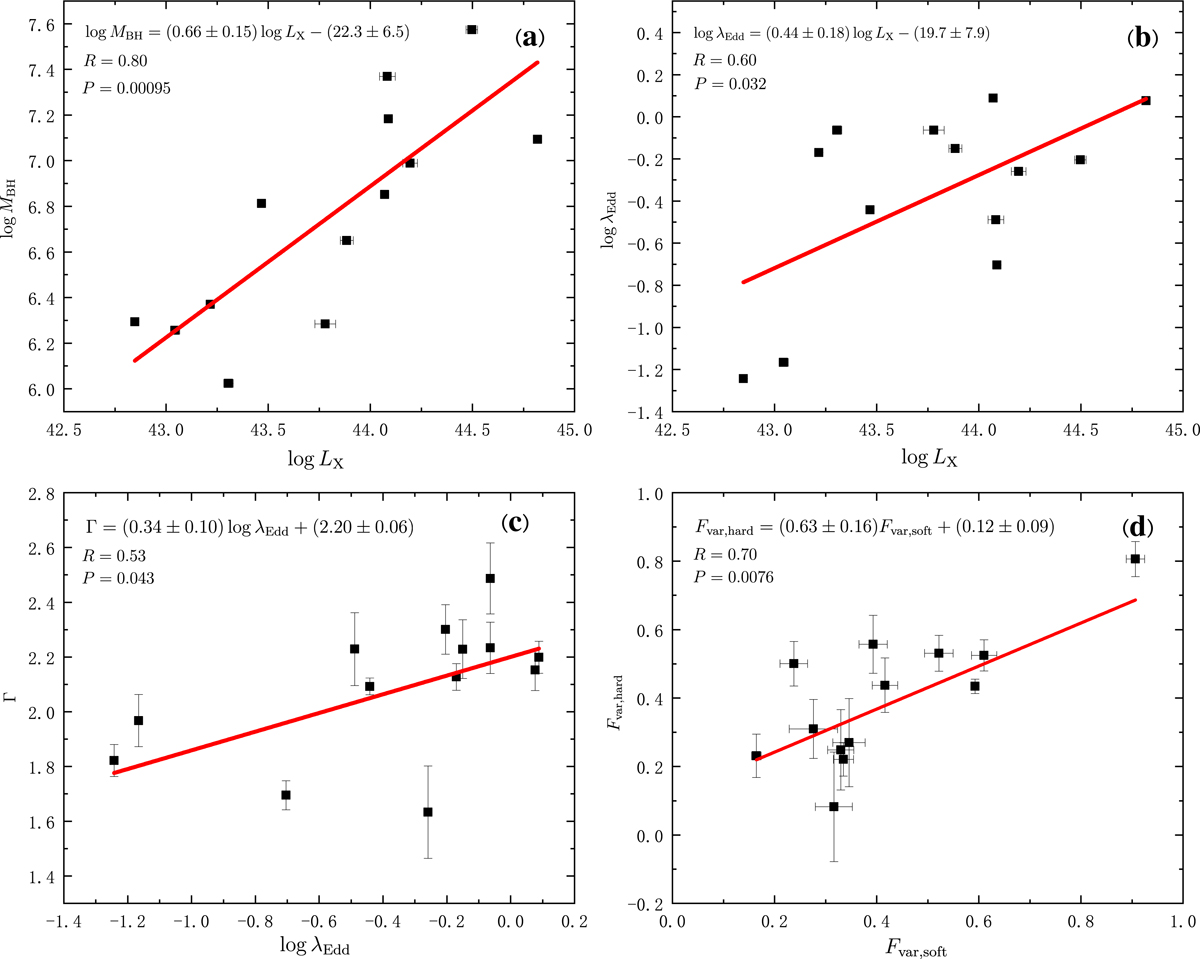
Parameter distribution plots of the four significant correlations and the corresponding linear fitting results. (a) Intrinsic X-ray luminosity vs. black hole mass. (b) Intrinsic X-ray luminosity vs. Eddington ratio. (c) Eddington ratio vs. power-law spectral index. (d) Soft X-ray variability amplitude vs. hard X-ray variability amplitude. The red line is the best linear fit. The linear relation is shown in the upper-left corner of each plane, together with the Pearson correlation coefficient (R) and chance probability (P).
Current usage metrics show cumulative count of Article Views (full-text article views including HTML views, PDF and ePub downloads, according to the available data) and Abstracts Views on Vision4Press platform.
Data correspond to usage on the plateform after 2015. The current usage metrics is available 48-96 hours after online publication and is updated daily on week days.
Initial download of the metrics may take a while.