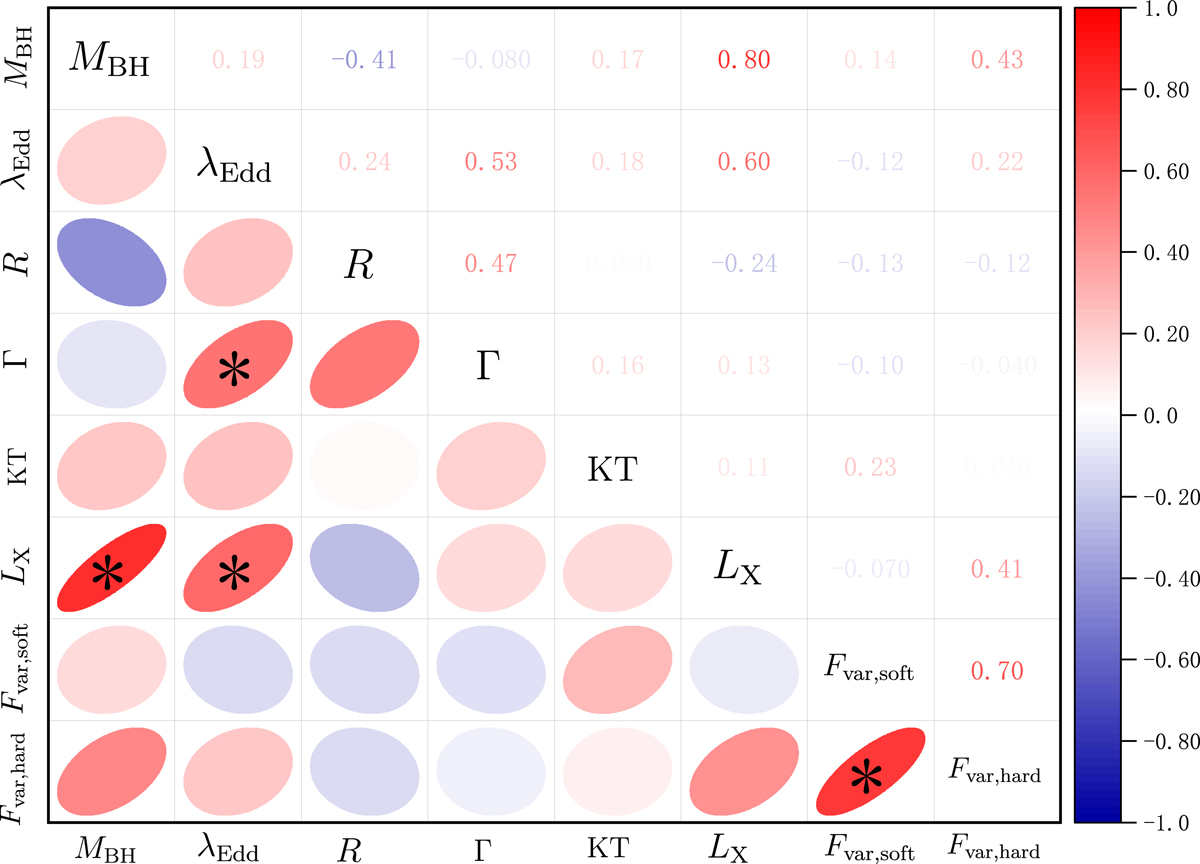
Fig. 6.
Download original image
Correlogram of the average state model parameters and other relevant physical parameters (black hole mass, Eddington ratio, intrinsic X-ray luminosity, and X-ray variability intensity in the soft and hard bands). The Pearson correlation coefficients for each parameter pair are given in the top-right grid. The colour bar on the left of the figure reflects the magnitude of the correlation coefficient. The correlation between the parameter pairs is graphically represented by an ellipse in the bottom-left grid, with red indicating a positive correlation and blue indicating an inverse correlation. The higher ellipticity means a closer correlation. Significant correlations with confidence levels above 95% are marked with an asterisk.
Current usage metrics show cumulative count of Article Views (full-text article views including HTML views, PDF and ePub downloads, according to the available data) and Abstracts Views on Vision4Press platform.
Data correspond to usage on the plateform after 2015. The current usage metrics is available 48-96 hours after online publication and is updated daily on week days.
Initial download of the metrics may take a while.