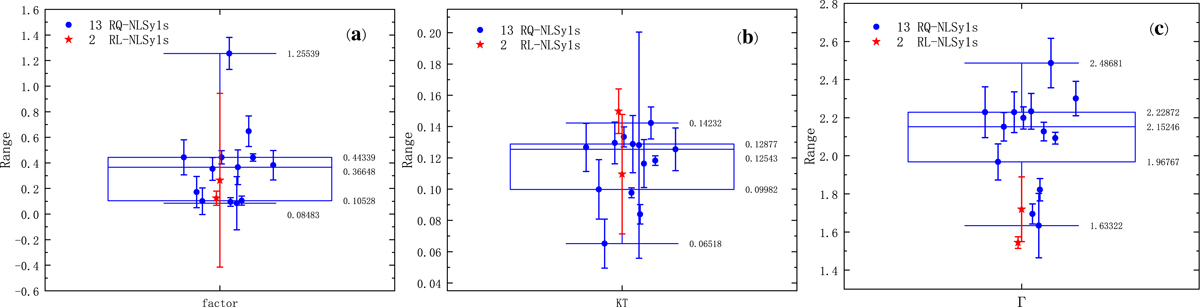
Fig. 5.
Download original image
Box plots of the average state model parameters of the 15 NLSy1s. (a) Soft X-ray relative excess intensity. (b) Temperature parameter of the zbbody component. (c) Power-law spectral index. Two radio-loud NLSy1s are marked with the red pentagram. The box represents 25%, 50%, and 75% quantiles of the 13 RQ-NLSy1 data, and the error bar of the box represents the maximum and minimum values of the dataset.
Current usage metrics show cumulative count of Article Views (full-text article views including HTML views, PDF and ePub downloads, according to the available data) and Abstracts Views on Vision4Press platform.
Data correspond to usage on the plateform after 2015. The current usage metrics is available 48-96 hours after online publication and is updated daily on week days.
Initial download of the metrics may take a while.