Free Access
Fig. 3.
Download original image
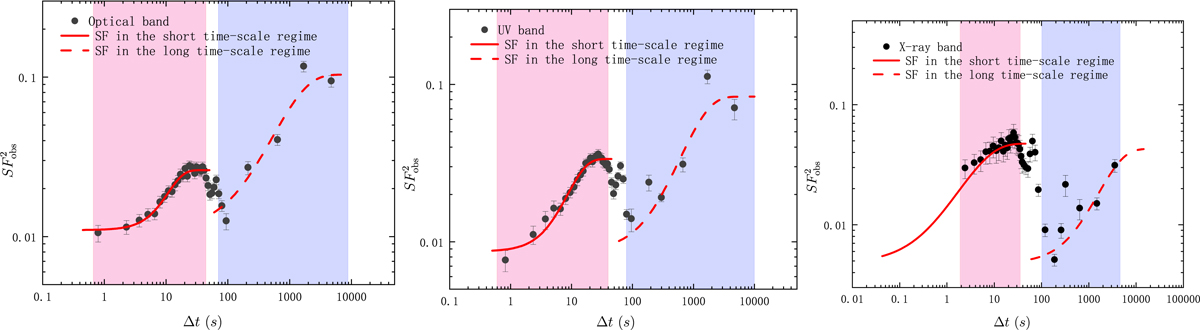
Ensemble SFs in the optical, UV, and X-ray bands, respectively. The solid and dotted red lines are the fitting results of the full four-parameter expression for the data points in the short timescale regime (the red shaded area) and the long timescale regime (the blue shaded area), respectively.
Current usage metrics show cumulative count of Article Views (full-text article views including HTML views, PDF and ePub downloads, according to the available data) and Abstracts Views on Vision4Press platform.
Data correspond to usage on the plateform after 2015. The current usage metrics is available 48-96 hours after online publication and is updated daily on week days.
Initial download of the metrics may take a while.