Fig. 9
Download original image
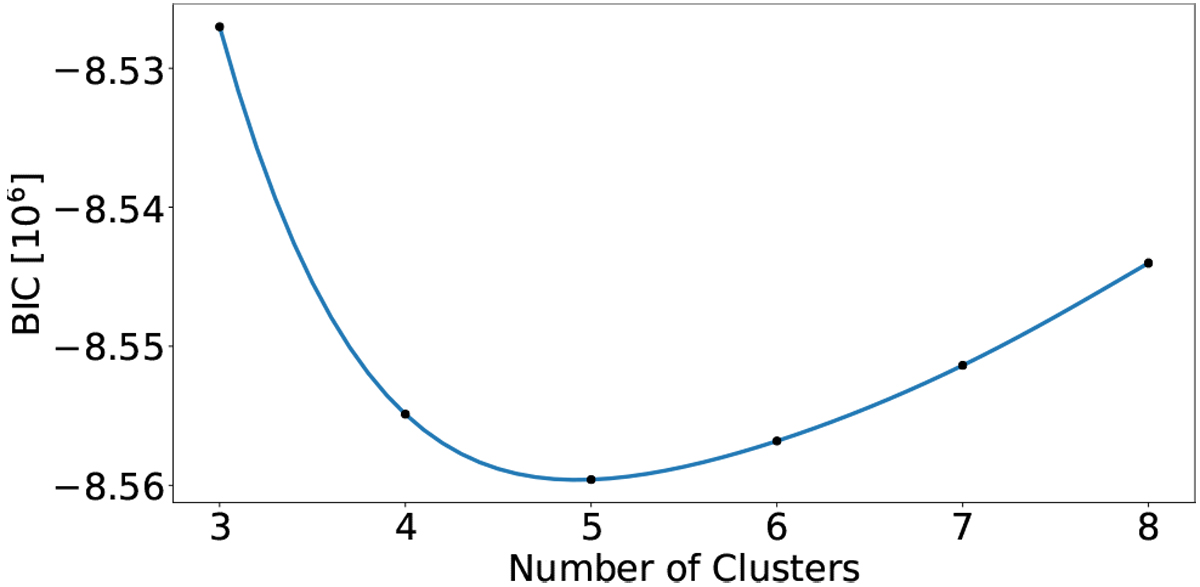
Bayesian information criterion. The black points represent the mean BIC value for each cluster ki of the 13CO spectral cube. The error bars (which are very small and thus almost not visible) show the standard deviation. A parabolic fit is also shown (see blue line) visualizing the trend of the data points.
Current usage metrics show cumulative count of Article Views (full-text article views including HTML views, PDF and ePub downloads, according to the available data) and Abstracts Views on Vision4Press platform.
Data correspond to usage on the plateform after 2015. The current usage metrics is available 48-96 hours after online publication and is updated daily on week days.
Initial download of the metrics may take a while.