Fig. 8
Download original image
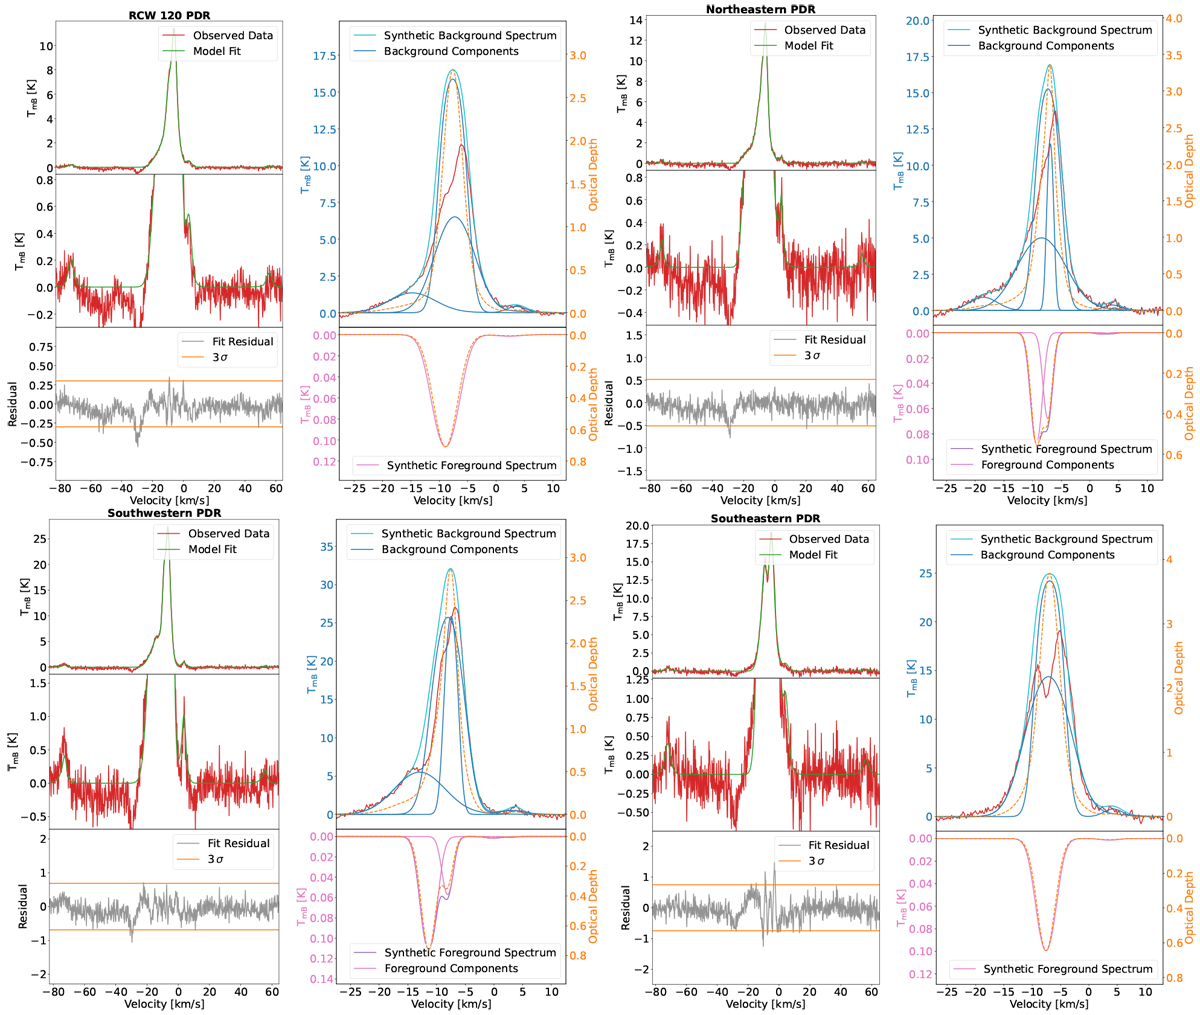
Two-layer multicomponent model results for the four regions extracted with the Dendogram technique. The left top subfigure is a template for all regions: The observed averaged [C II] spectrum is indicated in the left upper panel in red and the green curve on top is the resulting model fit. In the left middle panel, the temperature axis range is smaller so that the weak [13C II] satellitesaround the main isotope line are clearly visible. The left lower panel shows residuals of the fit in gray and the two horizontal orange lines indicate the 3σ level. In theright top panel the red spectrum once more displays the observed [C II] emission and the dark blue lines show the single Gaussian components. The light blue line is the superposition of all synthetic background components. The dashed orange line indicates the velocity resolved optical depth (values on the right axis). The right lower panel shows the pink single foreground Gaussian components and the violet line indicates the superposition of all the synthetic foreground components. The dashed orange line illustrates again the velocity resolved optical depth.
Current usage metrics show cumulative count of Article Views (full-text article views including HTML views, PDF and ePub downloads, according to the available data) and Abstracts Views on Vision4Press platform.
Data correspond to usage on the plateform after 2015. The current usage metrics is available 48-96 hours after online publication and is updated daily on week days.
Initial download of the metrics may take a while.