Fig. 7
Download original image
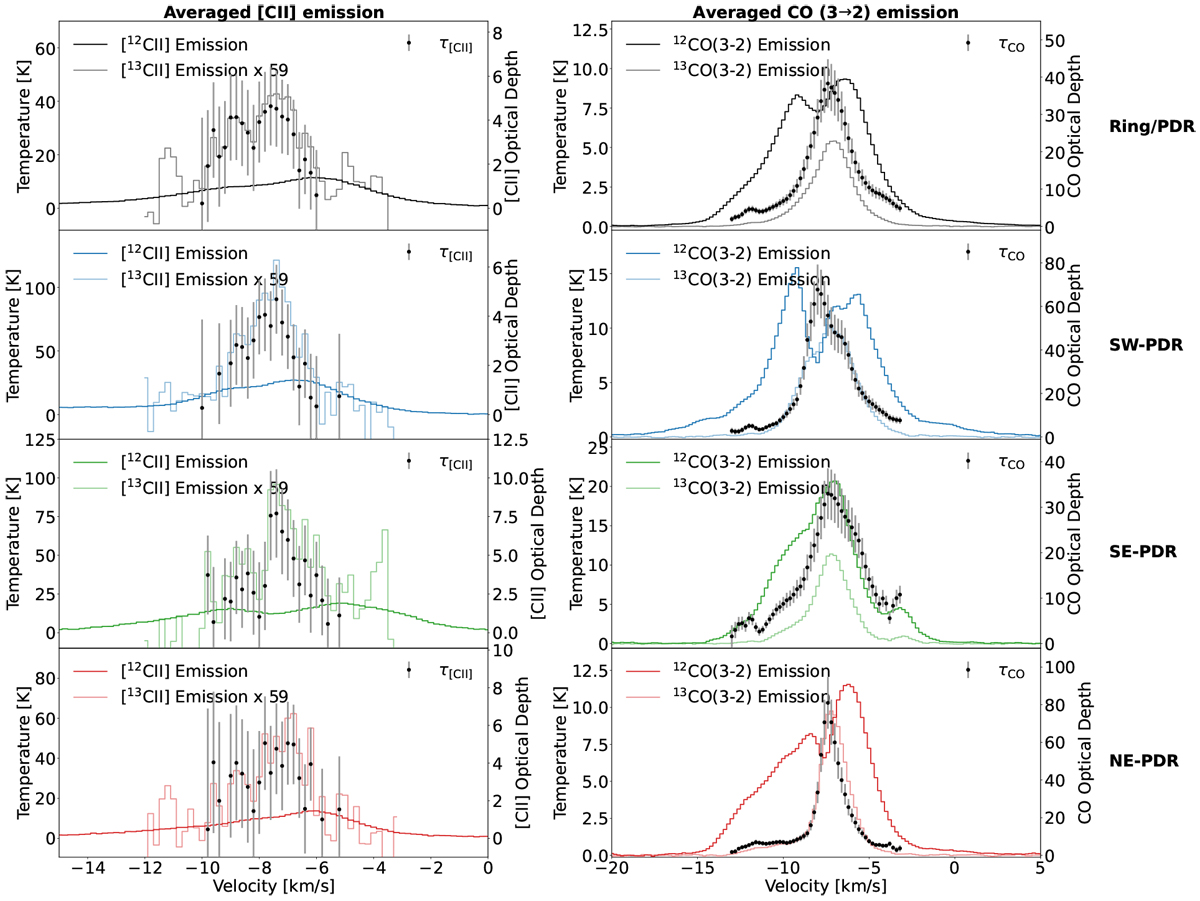
Averaged spectra of the structures along the ring of RCW 120, sorted by the regions indicated in Fig. 2 (ring, southwestern PDR, southeastern PDR and northeastern PDR). Left panels: averaged [12C II] and scaled up [13C II] emission by the local abundance 12C/13C-ratio of 59. Right panels: averaged 12CO and 13CO (3 →2) emission. The black data points with error bars indicate the velocity resolved optical depth.
Current usage metrics show cumulative count of Article Views (full-text article views including HTML views, PDF and ePub downloads, according to the available data) and Abstracts Views on Vision4Press platform.
Data correspond to usage on the plateform after 2015. The current usage metrics is available 48-96 hours after online publication and is updated daily on week days.
Initial download of the metrics may take a while.