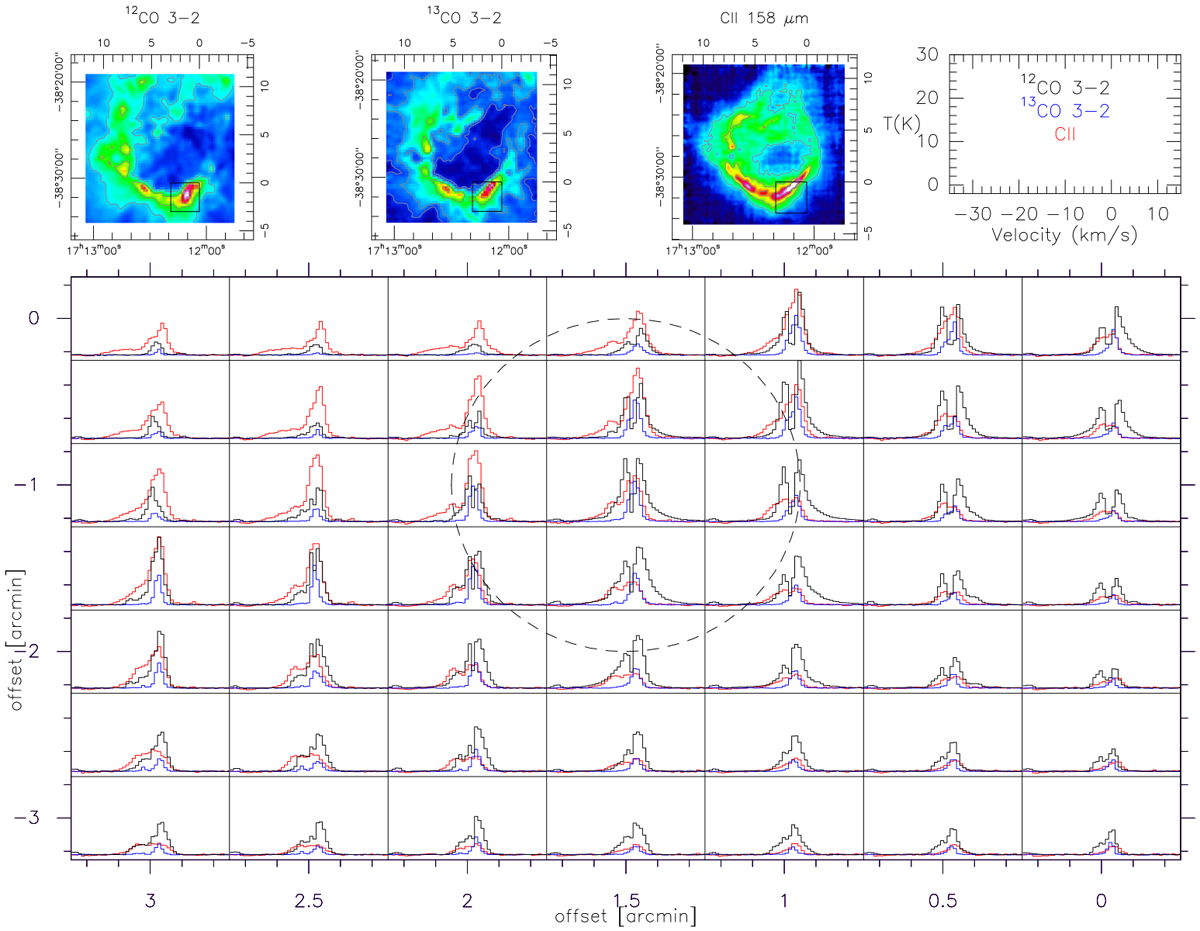
Fig. 5
Download original image
The three top panels show the line integrated 12CO, 13CO (3 →2) and [C II] emission (from left to right, v = −20 to 10 km s−1). The black square in each panel indicates the area where spectra of these lines are shown in the box below. 12CO and 13CO are indicated in black and blue, respectively, the [C II] spectra in red. We note that there is no scaling for any of the lines. The x- and y-axis for the spectra are shown in the top right panel. The spatial offsets are given in arcmin in all panels, the (0,0) position refers to RA(2000) = 17h12m03.65s, DEC(2000) = −38°30′28.4″ (see upper panels). All spectra were smoothed to an angular resolution of 30″ and are displayed in a grid of 30″. This cutout includes the clump with condensation 1 (Zavagno et al. 2007), indicated by a dashed circle, with its prominent outflow source at offsets ~1.5′,−1′.
Current usage metrics show cumulative count of Article Views (full-text article views including HTML views, PDF and ePub downloads, according to the available data) and Abstracts Views on Vision4Press platform.
Data correspond to usage on the plateform after 2015. The current usage metrics is available 48-96 hours after online publication and is updated daily on week days.
Initial download of the metrics may take a while.