Fig. 3
Download original image
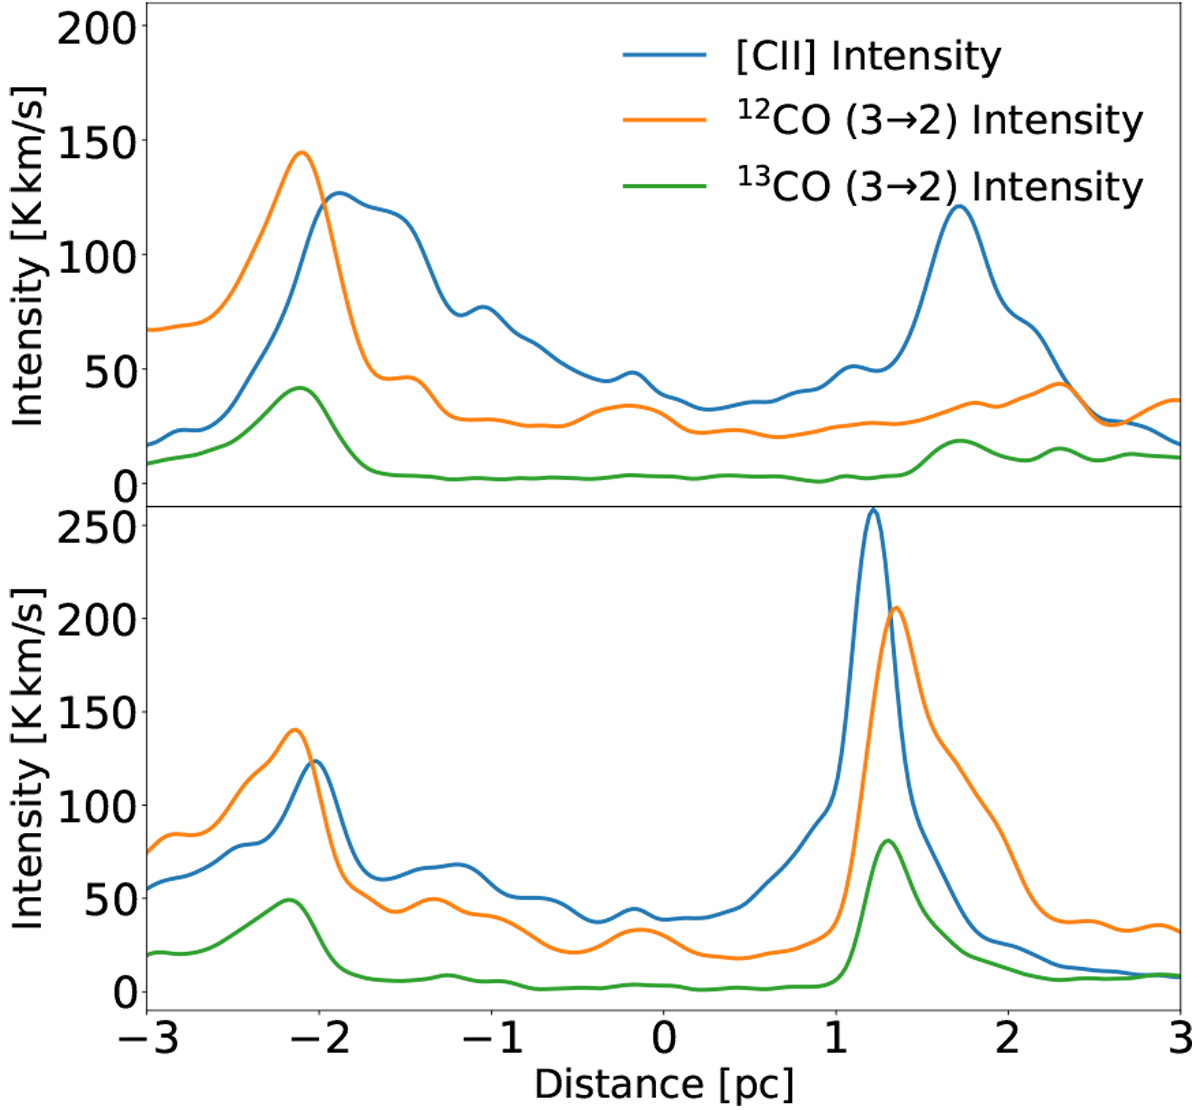
Position-intensity diagram along two cuts. The positions of both cuts are indicated by the gray lines crossing the ionizing star (central position) in Fig. 2, negative distances are to the east and northeast. The upper panel shows the intensity along the horizontal line and the lower one the intensity along the diagonal cut (25°). The [C II] and 12CO and 13CO (3 →2) intensities are indicated by a blue, orange, and green curve, respectively.
Current usage metrics show cumulative count of Article Views (full-text article views including HTML views, PDF and ePub downloads, according to the available data) and Abstracts Views on Vision4Press platform.
Data correspond to usage on the plateform after 2015. The current usage metrics is available 48-96 hours after online publication and is updated daily on week days.
Initial download of the metrics may take a while.