Fig. D.1
Download original image
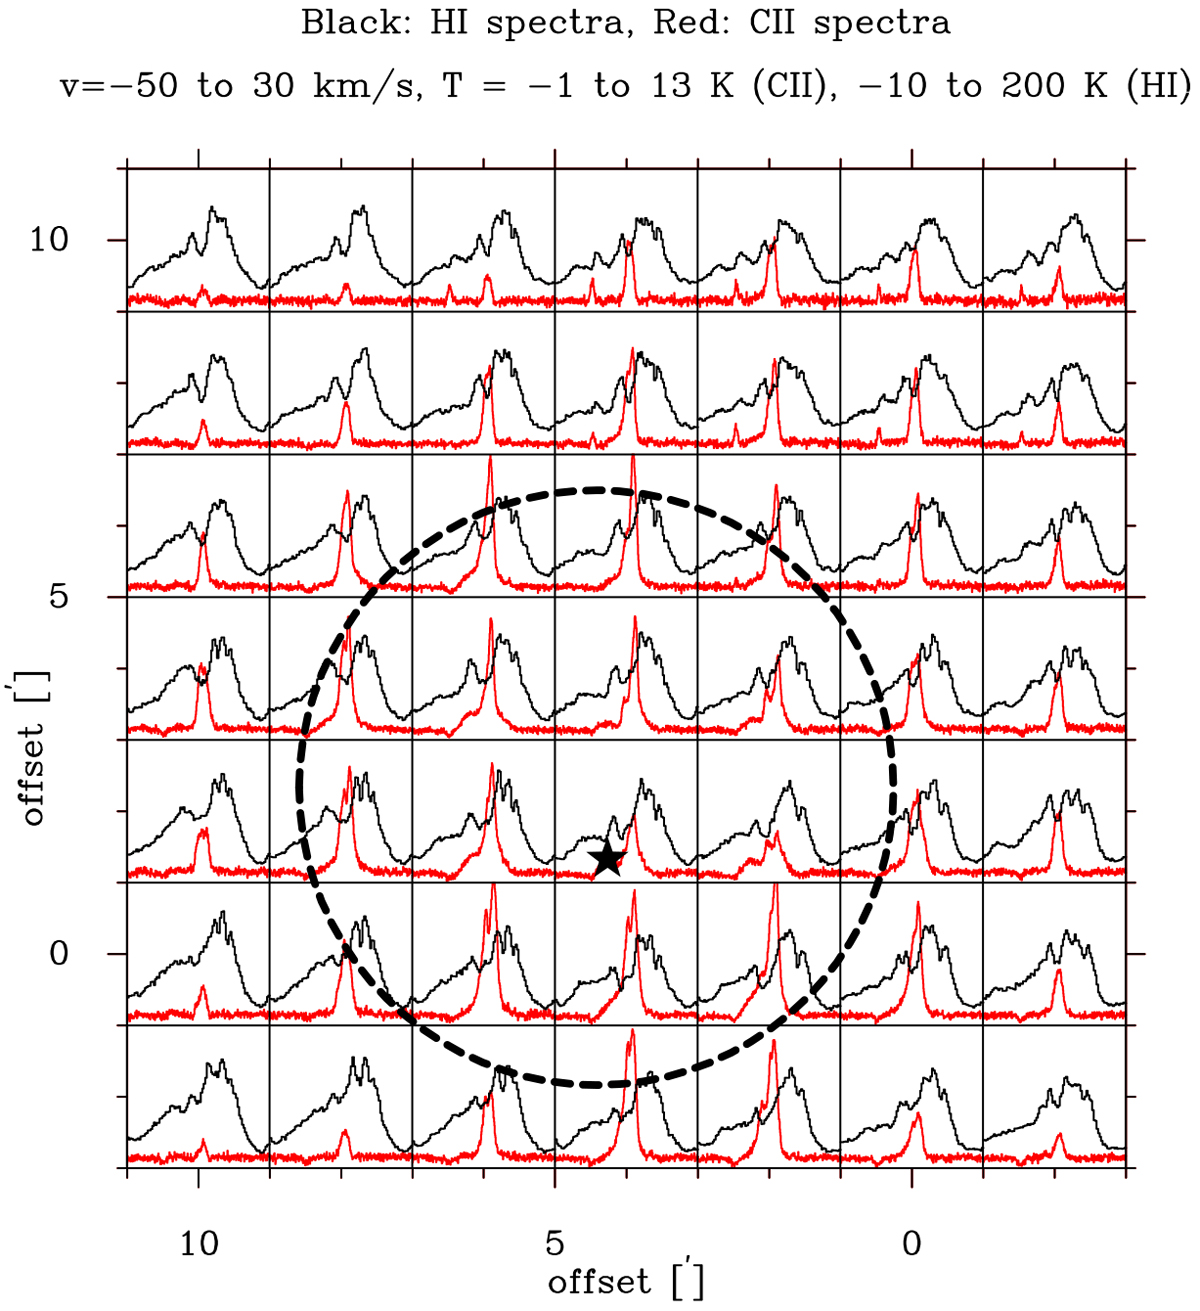
Overlay between H I (black) and [C II] (red) spectra at an angular resolution of 2′ in a grid of 2′. The PDR ring of RCW 120 is indicated with a dashed black circle and the O star with a black star symbol. The velocity and temperature ranges are given in the upper caption. This plot is intended to show qualitatively that thereis a systematic H I depression at velocities around the bulk emission velocity of the cloud at − 8 km s−1. The [C II] line shows self-absorption at that velocity (and flat-top spectra) which is not so prominent in this display because the spectra are smoothed to 2′ resolution.
Current usage metrics show cumulative count of Article Views (full-text article views including HTML views, PDF and ePub downloads, according to the available data) and Abstracts Views on Vision4Press platform.
Data correspond to usage on the plateform after 2015. The current usage metrics is available 48-96 hours after online publication and is updated daily on week days.
Initial download of the metrics may take a while.