Fig. 17
Download original image
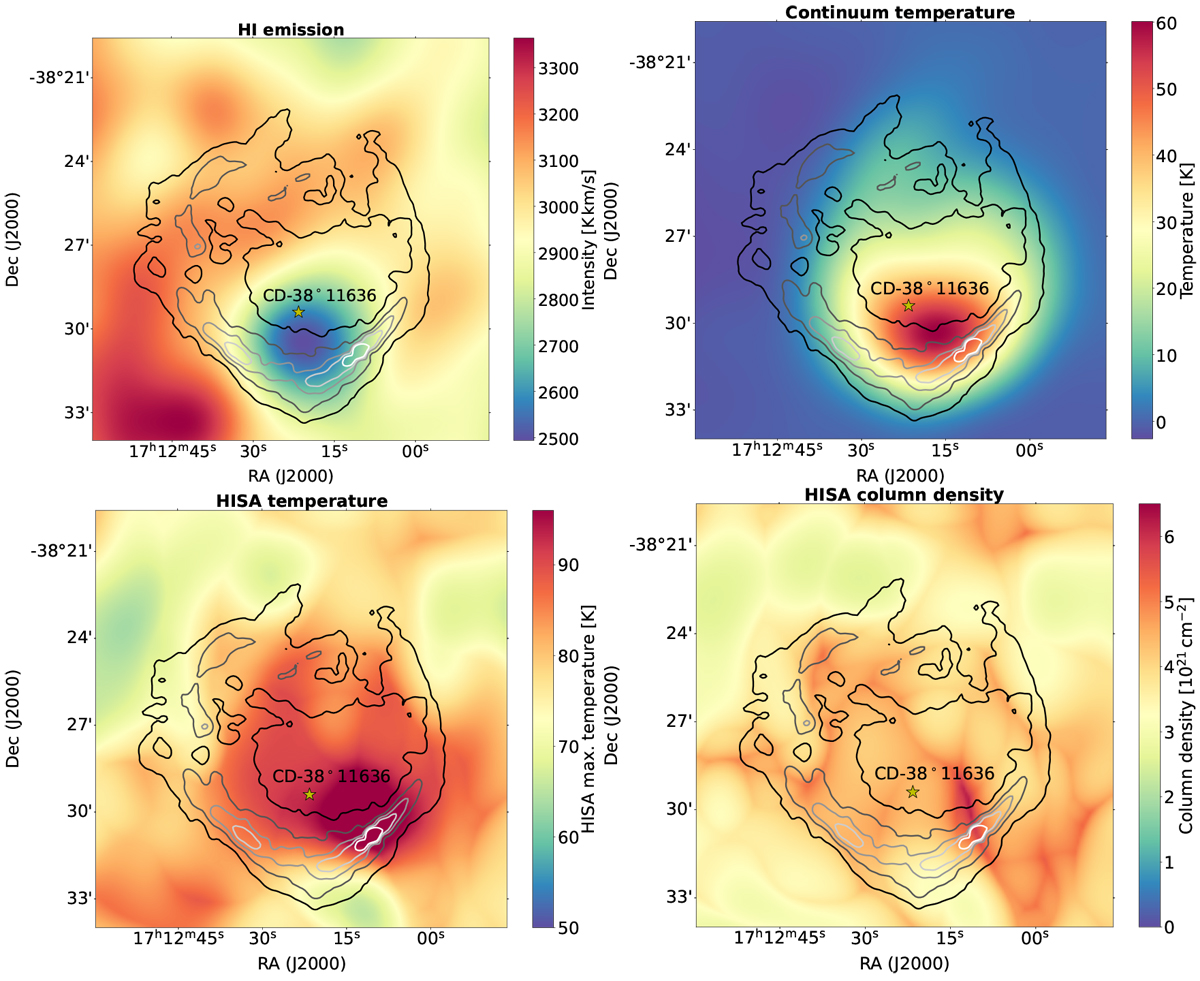
HISA properties. Top left: line integrated H I emission between −20 to 10 km s−1. Top right: continuum temperature map from 1.4 GHz emission. Lower left: upper limit of HISA temperature. Lower right: HISAcolumn density distribution. The contours give the line integrated [C II] intensity levels 60, 100, 140, 180, 220 K km s−1, ranging from black to light gray.
Current usage metrics show cumulative count of Article Views (full-text article views including HTML views, PDF and ePub downloads, according to the available data) and Abstracts Views on Vision4Press platform.
Data correspond to usage on the plateform after 2015. The current usage metrics is available 48-96 hours after online publication and is updated daily on week days.
Initial download of the metrics may take a while.