Fig. 12
Download original image
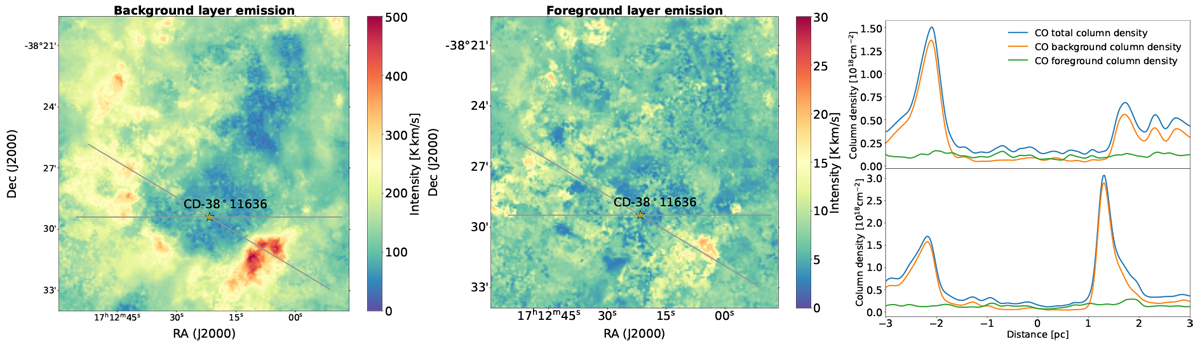
Line integrated 12CO (3 →2) synthetic maps and cuts. Left panel: spatial distribution of the warm background emitting layer. Middle panel: spatial distribution of the cold foreground absorbing layer. Right panel: position-intensity diagram along the two cuts indicated by the gray lines crossing the ionizing star. The upper panel shows the horizontal cut and the lower panel shows the diagonal cut. The orange curve is showing the column density of the emitting background layer, the green curve shows the column number density of the absorbing foreground layer and the blue curve indicates the combined column density of both layers.
Current usage metrics show cumulative count of Article Views (full-text article views including HTML views, PDF and ePub downloads, according to the available data) and Abstracts Views on Vision4Press platform.
Data correspond to usage on the plateform after 2015. The current usage metrics is available 48-96 hours after online publication and is updated daily on week days.
Initial download of the metrics may take a while.