Fig. 11
Download original image
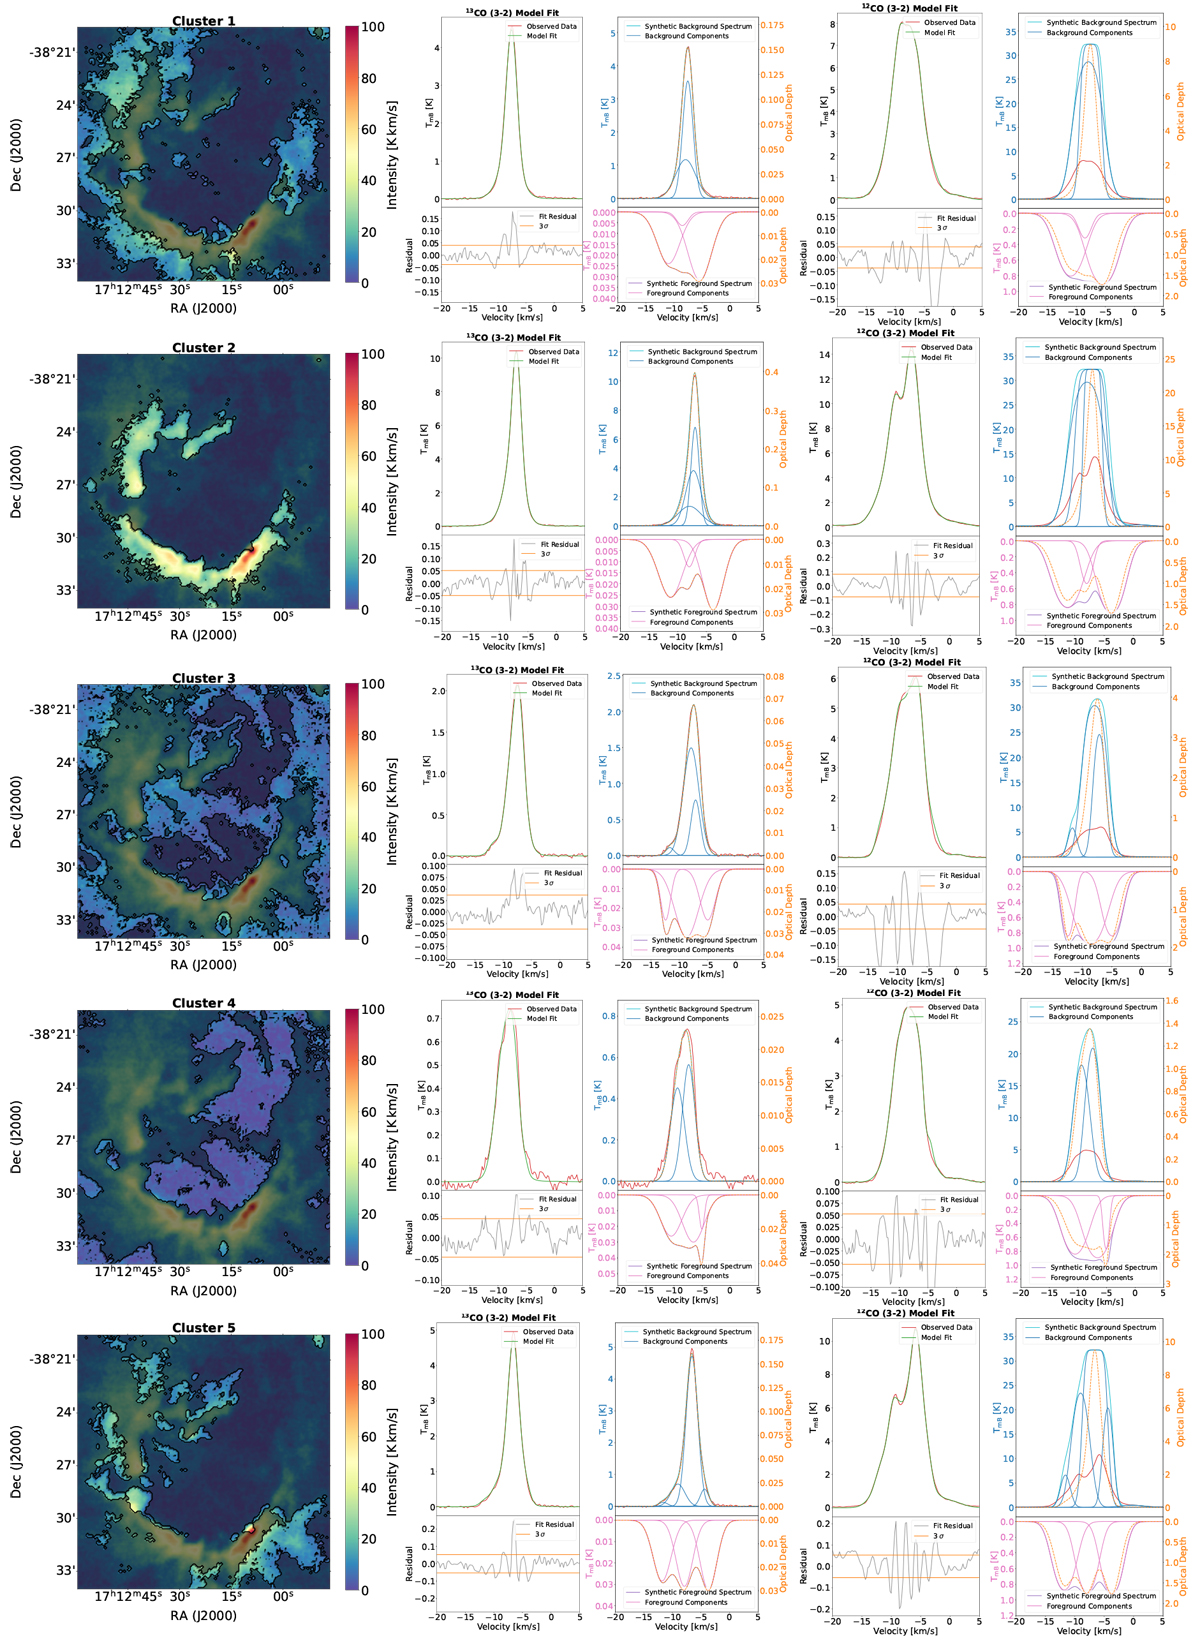
Two-layer multicomponent model fit to the average spectra of each cluster determined by the GMM. Left column: the black contours indicate the spatial location of the clusters. Area that is located outside the clusters is dark shaded. Following the middle and right columns: 13CO and 12CO (3 →2) model fits. All other parameters are as shown in Fig. 8. The red spectra in the upper left panelsindicate the observed CO lines and the green curve is the resulting model fit. In the panel below, the gray data points show the fit residual and the two horizontal orange lines indicate the 3σ level. In the upper right panels, the dark blue lines show the single Gaussian components and the light blue line the superposition of all synthetic background components. In the lower right panels, the pink line displays the single foreground Gaussian components and the magenta line shows the superposition of all synthetic foreground components. The dashed orange line indicates the velocity resolved optical depth.
Current usage metrics show cumulative count of Article Views (full-text article views including HTML views, PDF and ePub downloads, according to the available data) and Abstracts Views on Vision4Press platform.
Data correspond to usage on the plateform after 2015. The current usage metrics is available 48-96 hours after online publication and is updated daily on week days.
Initial download of the metrics may take a while.