Fig. 10
Download original image
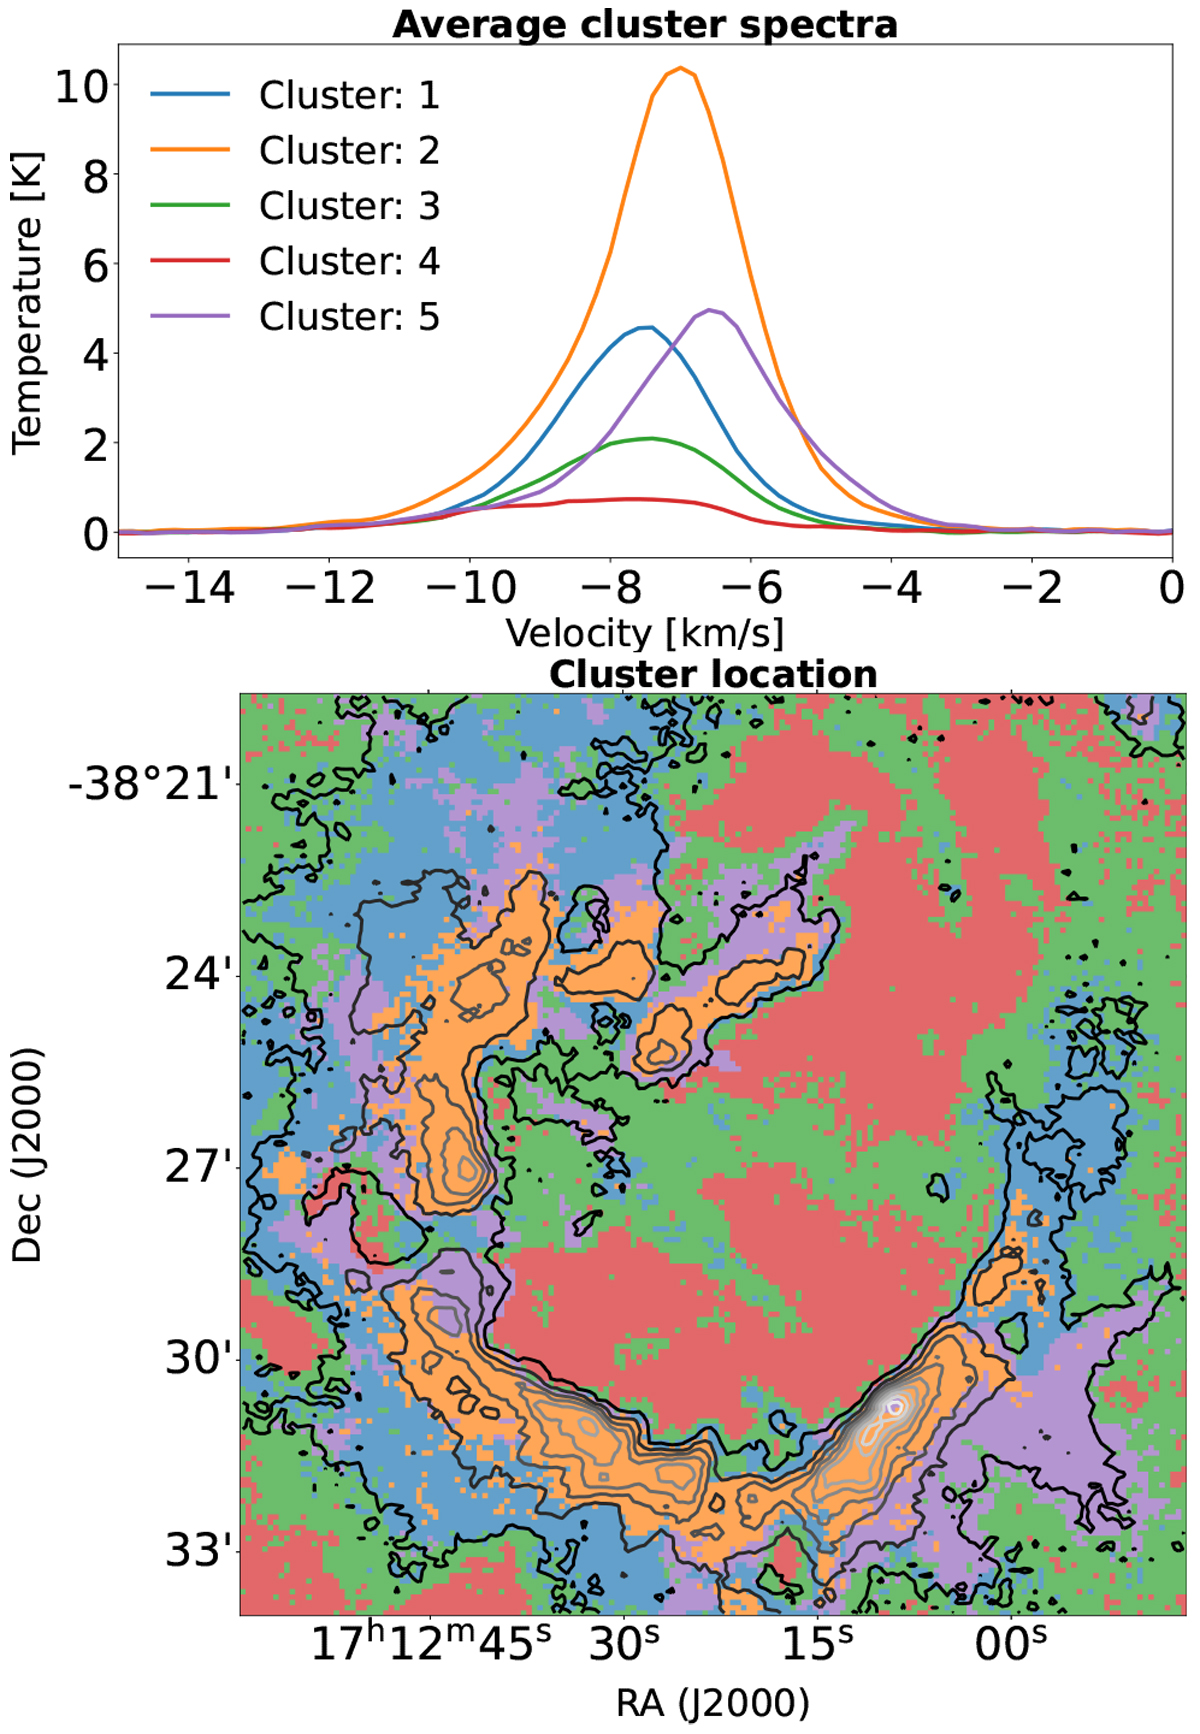
GMM clusters. Top panel: the average spectra of the clusters are plotted in different colors. Bottom panel: the corresponding cluster locations, adopting the same color scheme, are shown. The integrated 13CO (3 →2) emission is indicated by the contours.
Current usage metrics show cumulative count of Article Views (full-text article views including HTML views, PDF and ePub downloads, according to the available data) and Abstracts Views on Vision4Press platform.
Data correspond to usage on the plateform after 2015. The current usage metrics is available 48-96 hours after online publication and is updated daily on week days.
Initial download of the metrics may take a while.