Free Access
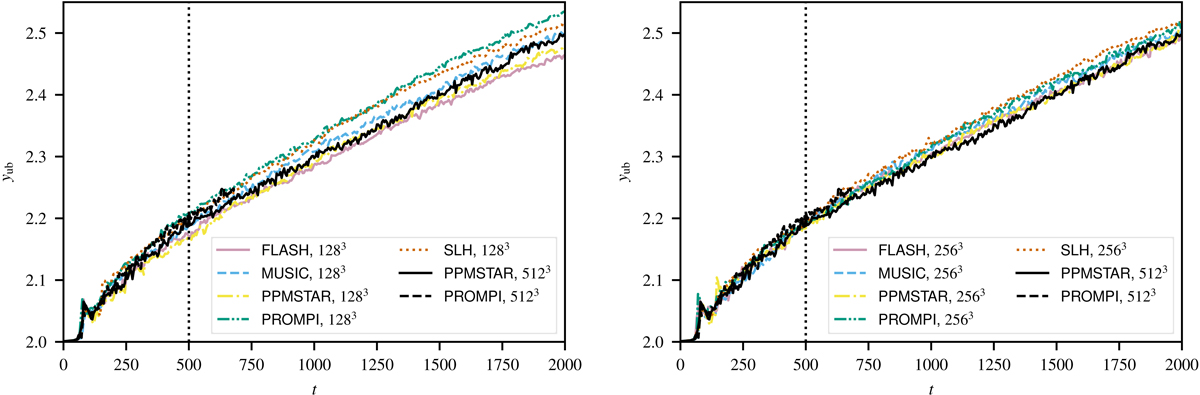
Fig. 9.
Download original image
Time evolution of the y coordinate of the upper boundary of the convection zone as determined from 1D averages. The dotted vertical line marks the end of the initial transient excluded from the analysis.
Current usage metrics show cumulative count of Article Views (full-text article views including HTML views, PDF and ePub downloads, according to the available data) and Abstracts Views on Vision4Press platform.
Data correspond to usage on the plateform after 2015. The current usage metrics is available 48-96 hours after online publication and is updated daily on week days.
Initial download of the metrics may take a while.