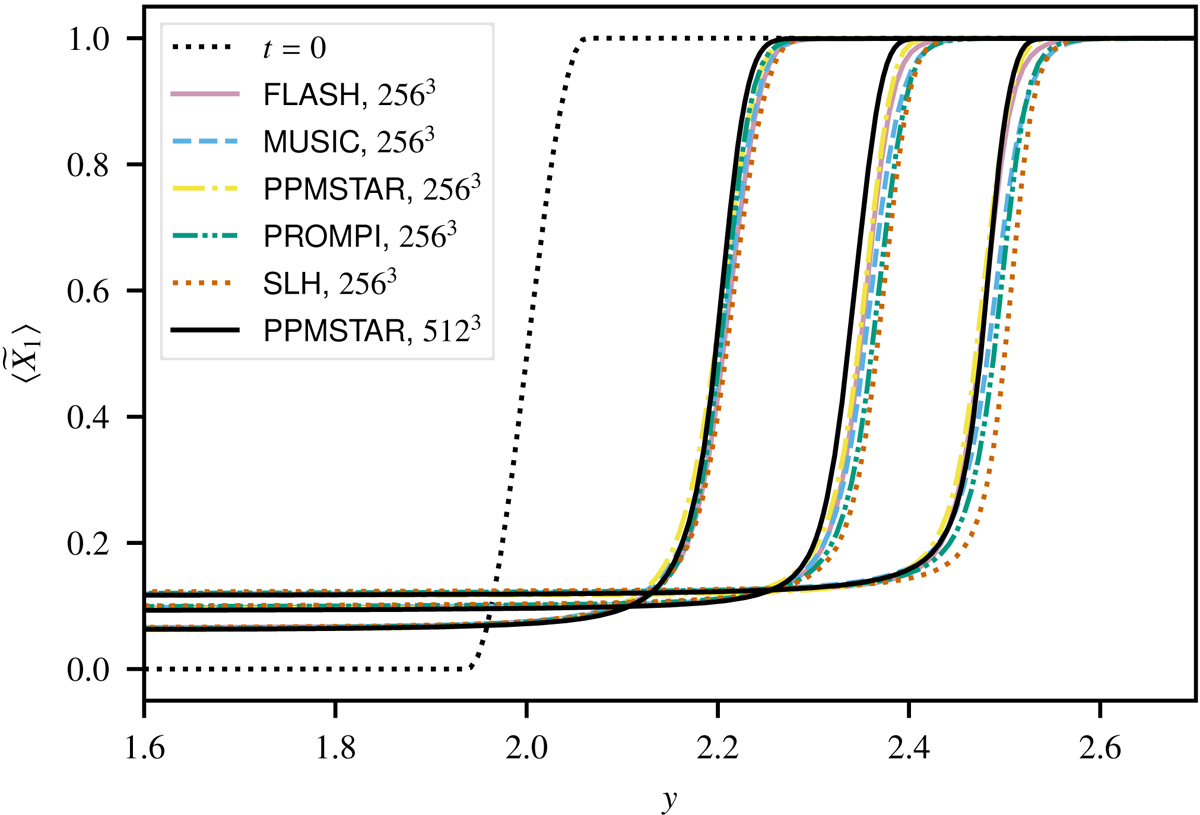
Fig. 8.
Download original image
Mass entrainment process visualised using vertical profiles of the mass fraction of the μ1 fluid. Only the uppermost parts of the convective layer and part of the stable layer are shown. The dotted line shows the initial condition and the remaining three sets of lines correspond to averages over time windows τav = 2τconv = 160 wide and centred on times of (from left to right) 580, 1250, and 1920.
Current usage metrics show cumulative count of Article Views (full-text article views including HTML views, PDF and ePub downloads, according to the available data) and Abstracts Views on Vision4Press platform.
Data correspond to usage on the plateform after 2015. The current usage metrics is available 48-96 hours after online publication and is updated daily on week days.
Initial download of the metrics may take a while.