Free Access
Fig. 16.
Download original image
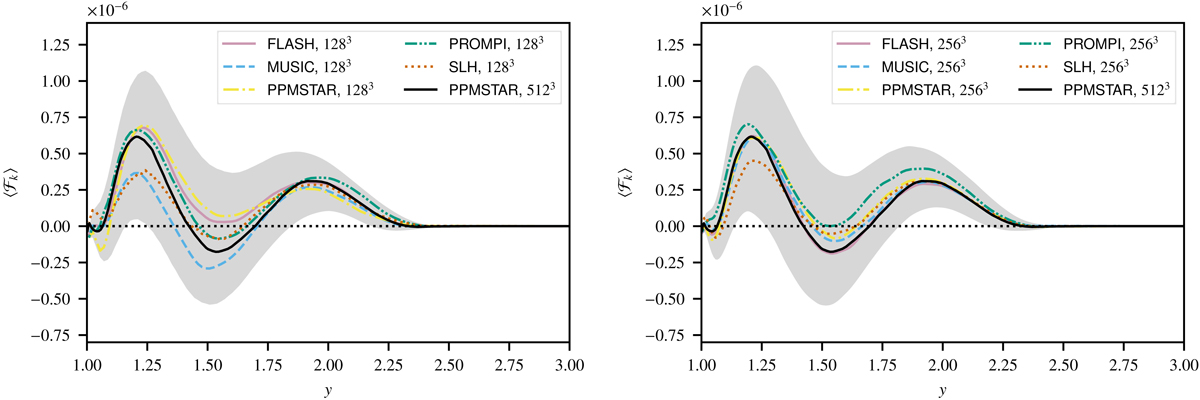
Vertical profiles of the kinetic-energy flux averaged over the whole analysis time interval (500 ≤ t ≤ 2000, approximately 19τconv). The grey bands give an estimate of ±3σ statistical variation in the averages due to stochasticity, see Sect. 3.1 for details.
Current usage metrics show cumulative count of Article Views (full-text article views including HTML views, PDF and ePub downloads, according to the available data) and Abstracts Views on Vision4Press platform.
Data correspond to usage on the plateform after 2015. The current usage metrics is available 48-96 hours after online publication and is updated daily on week days.
Initial download of the metrics may take a while.