Fig. 11.
Download original image
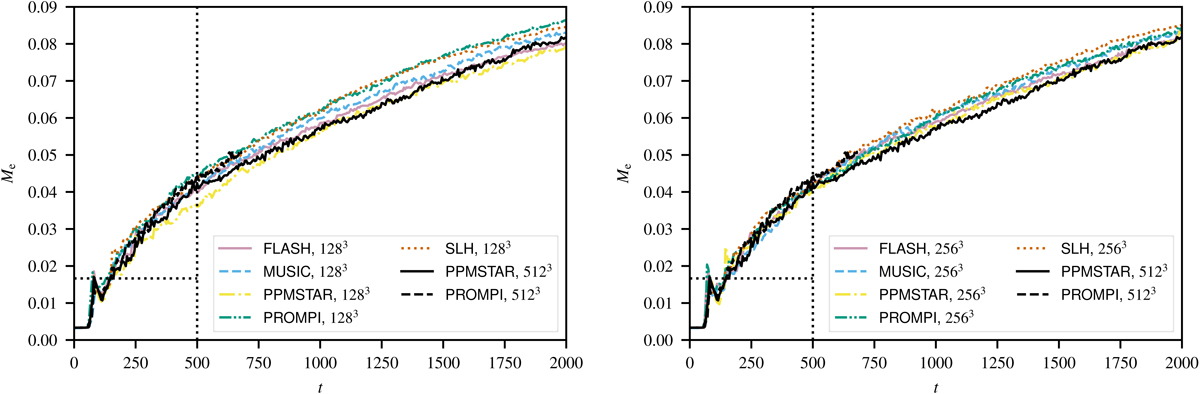
Mass per unit horizontal area of the μ1 fluid entrained into the convective layer as a function of time. The dotted vertical line marks the end of the initial transient excluded from the analysis. The dotted horizontal line shows the amount of the μ1 fluid contained in the initial transition zone between the convective and stable layer.
Current usage metrics show cumulative count of Article Views (full-text article views including HTML views, PDF and ePub downloads, according to the available data) and Abstracts Views on Vision4Press platform.
Data correspond to usage on the plateform after 2015. The current usage metrics is available 48-96 hours after online publication and is updated daily on week days.
Initial download of the metrics may take a while.