Fig. 1.
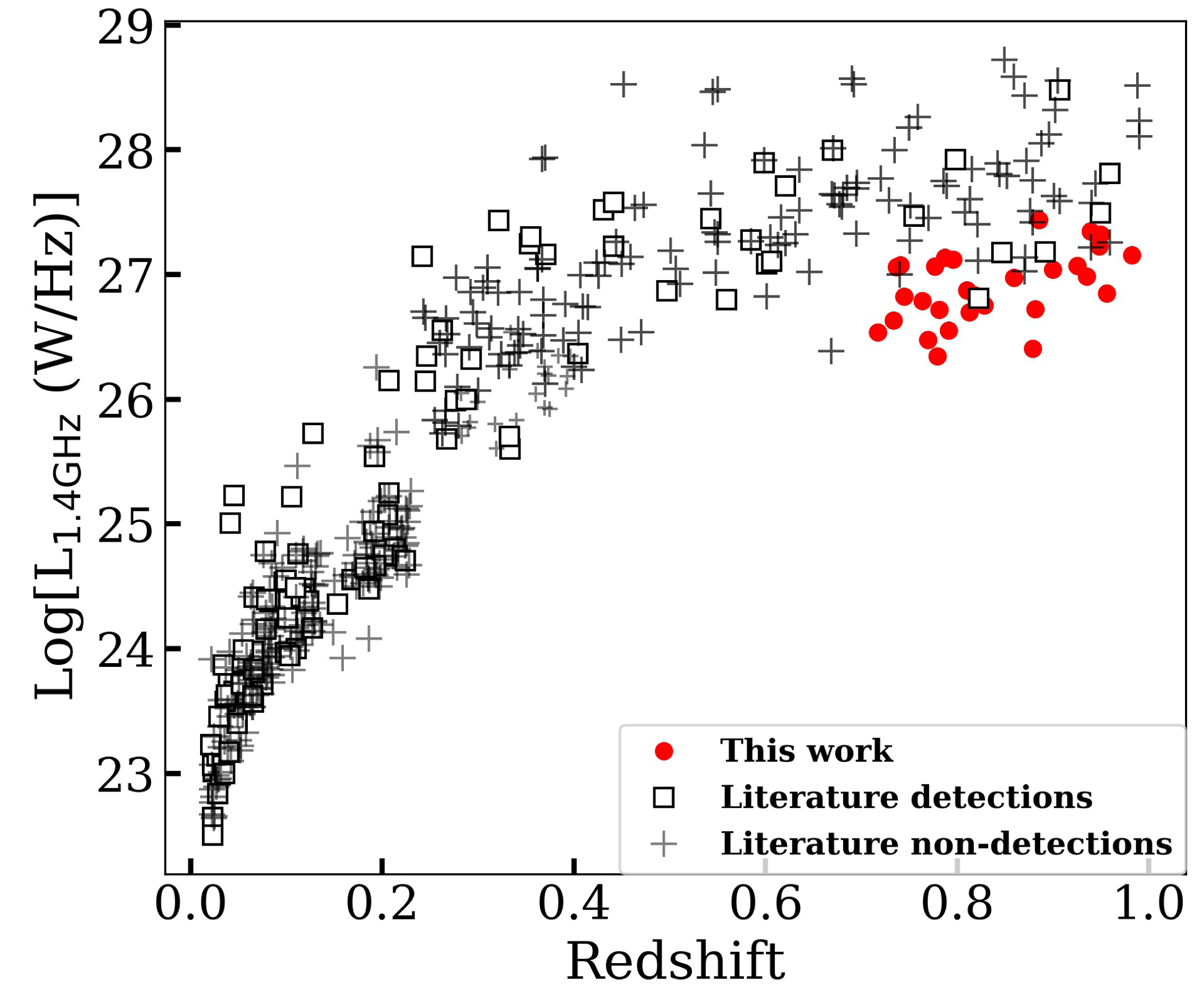
Download original image
Distribution of radio luminosities as a function of redshift. Our sample is shown in red, and the searches reported in the literature are shown in black. At z < 0.25, the plot shows the sample of Maccagni et al. (2017). At z > 0.25 the searches are from Carilli & van Gorkom (1992), Carilli et al. (1998), Pihlström et al. (2003), Vermeulen et al. (2003), Gupta et al. (2006), Orienti et al. (2006), Curran et al. (2006, 2011, 2017, 2019), Allison et al. (2015), Yan et al. (2016), Ostorero et al. (2017), Aditya & Kanekar (2018a,b), Aditya (2019), Grasha et al. (2019), Mhaskey et al. (2020), and Murthy et al. (2021).
Current usage metrics show cumulative count of Article Views (full-text article views including HTML views, PDF and ePub downloads, according to the available data) and Abstracts Views on Vision4Press platform.
Data correspond to usage on the plateform after 2015. The current usage metrics is available 48-96 hours after online publication and is updated daily on week days.
Initial download of the metrics may take a while.