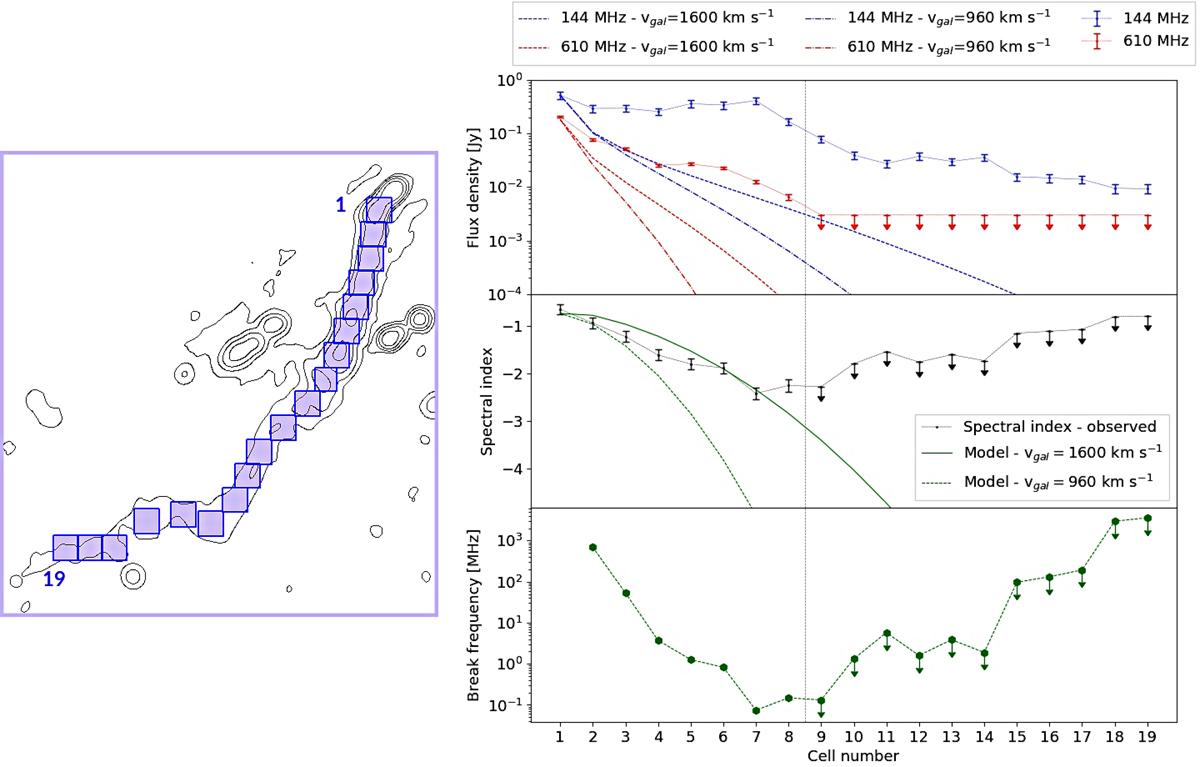
Fig. 7.
Download original image
Left: 3, 48, 96, and 192σ levels of the 144 MHz radio emission (σ = 750 μJy beam−1 and a resolution of 30 × 30 arcsec) with the sampling cells on top. Right: observed and model profiles of flux density (top), spectral index (middle), and break frequency (bottom). The upper limits were computed based on the 2σ level of the 610 MHz map. In the top and middle panels, the predictions are reported based on the two different galactic velocities.
Current usage metrics show cumulative count of Article Views (full-text article views including HTML views, PDF and ePub downloads, according to the available data) and Abstracts Views on Vision4Press platform.
Data correspond to usage on the plateform after 2015. The current usage metrics is available 48-96 hours after online publication and is updated daily on week days.
Initial download of the metrics may take a while.