Fig. 4.
Download original image
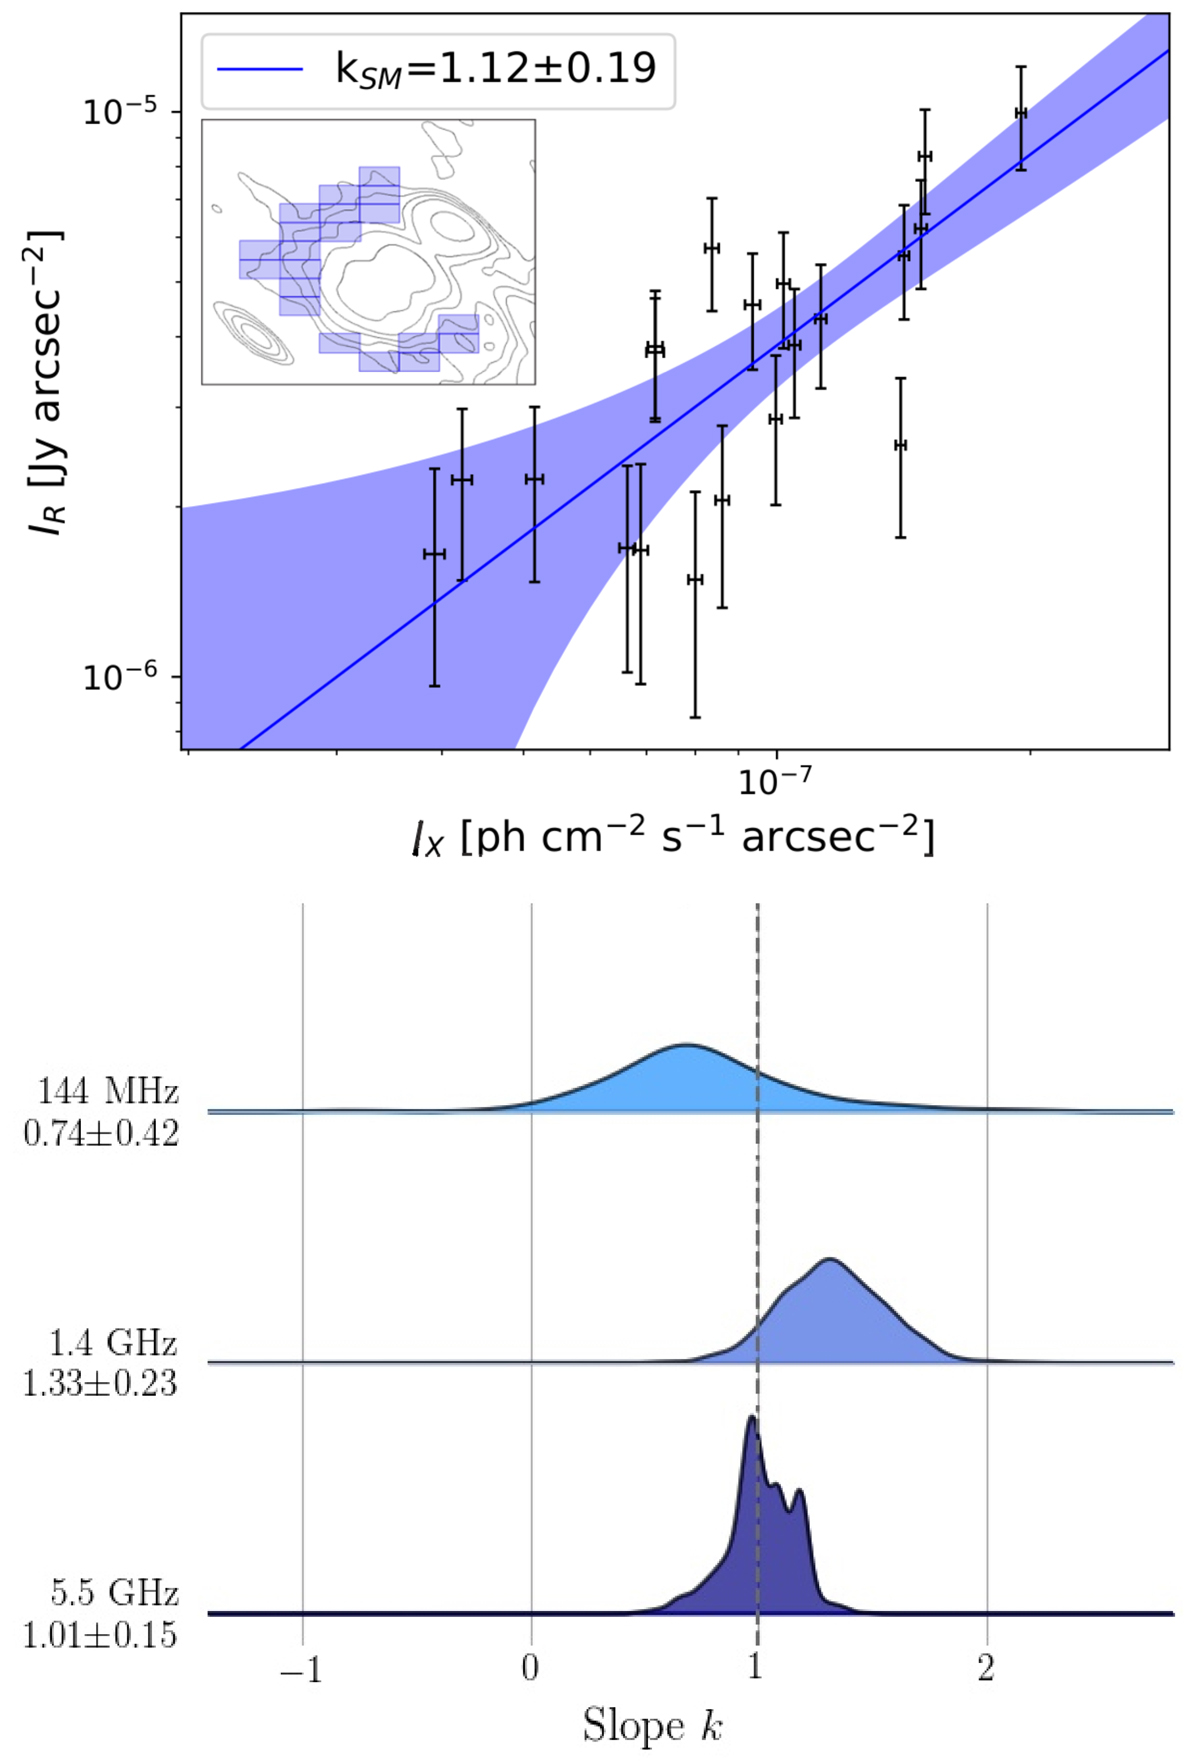
Top: result of the single-mesh point-to-point analysis. The slope of the best-fitting power-law ![]() is reported in the legend, and the insert presents the sampling grid overlaid on the low-resolution 144 MHz map (Fig. 1). The blue-shaded region indicates the 90% confidence interval of the fit. Bottom: slope index distributions produced by the MCptp analysis at 0.144 MHz as well as 1.4 and 5.5 GHz (from Ignesti et al. 2020). The mean and standard deviation of each distribution is shown in the labels.
is reported in the legend, and the insert presents the sampling grid overlaid on the low-resolution 144 MHz map (Fig. 1). The blue-shaded region indicates the 90% confidence interval of the fit. Bottom: slope index distributions produced by the MCptp analysis at 0.144 MHz as well as 1.4 and 5.5 GHz (from Ignesti et al. 2020). The mean and standard deviation of each distribution is shown in the labels.
Current usage metrics show cumulative count of Article Views (full-text article views including HTML views, PDF and ePub downloads, according to the available data) and Abstracts Views on Vision4Press platform.
Data correspond to usage on the plateform after 2015. The current usage metrics is available 48-96 hours after online publication and is updated daily on week days.
Initial download of the metrics may take a while.