Fig. 2.
Download original image
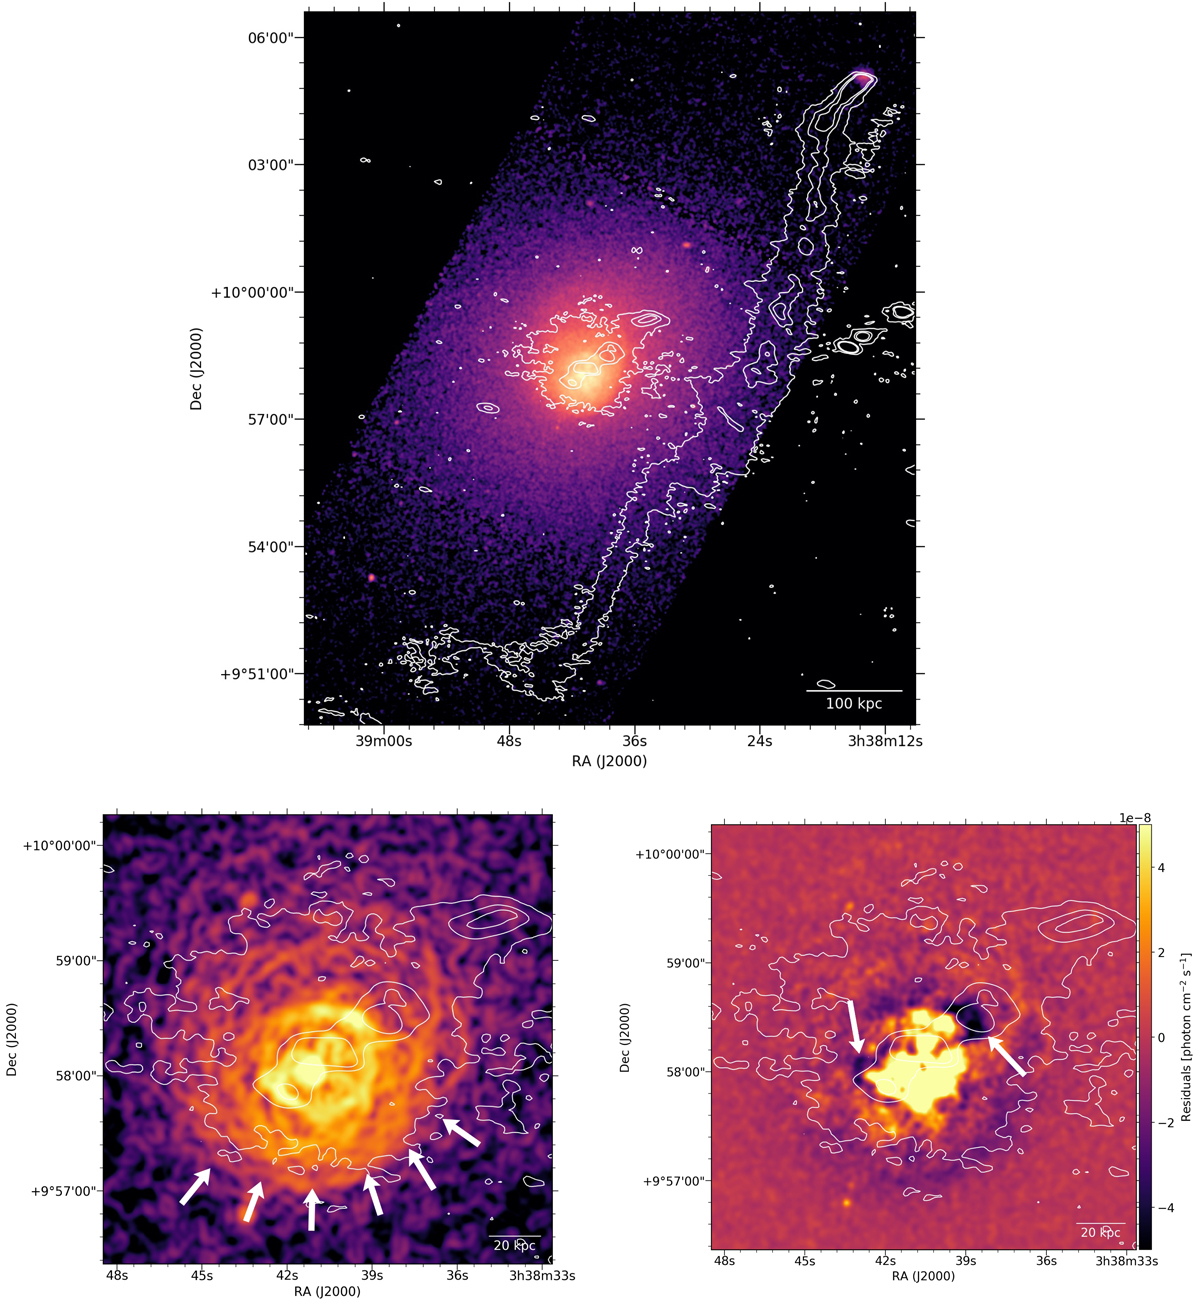
Top: LOFAR contours at 144 MHz of the mid-resolution image (panel b, Fig. 1, σ = 231 μJy beam−1, and a resolution of 14″ × 5″) at the 3, 24, and 96σ levels on top of the background-subtracted, exposure-corrected Chandra image in the 0.5 − 2.0 keV band. Bottom left: GGM-processed X-ray image produced with σ = 4 and the 144 MHz emission contours on top. Bottom right: residual unsharp-masked image obtained by combining X-ray maps smoothed with 3 and 30 pixel-wide Gaussians with the 144 MHz emission contours on top. The white arrows in the bottom panels point to the spiral pattern and the cavities described in Sect. 3.1.
Current usage metrics show cumulative count of Article Views (full-text article views including HTML views, PDF and ePub downloads, according to the available data) and Abstracts Views on Vision4Press platform.
Data correspond to usage on the plateform after 2015. The current usage metrics is available 48-96 hours after online publication and is updated daily on week days.
Initial download of the metrics may take a while.