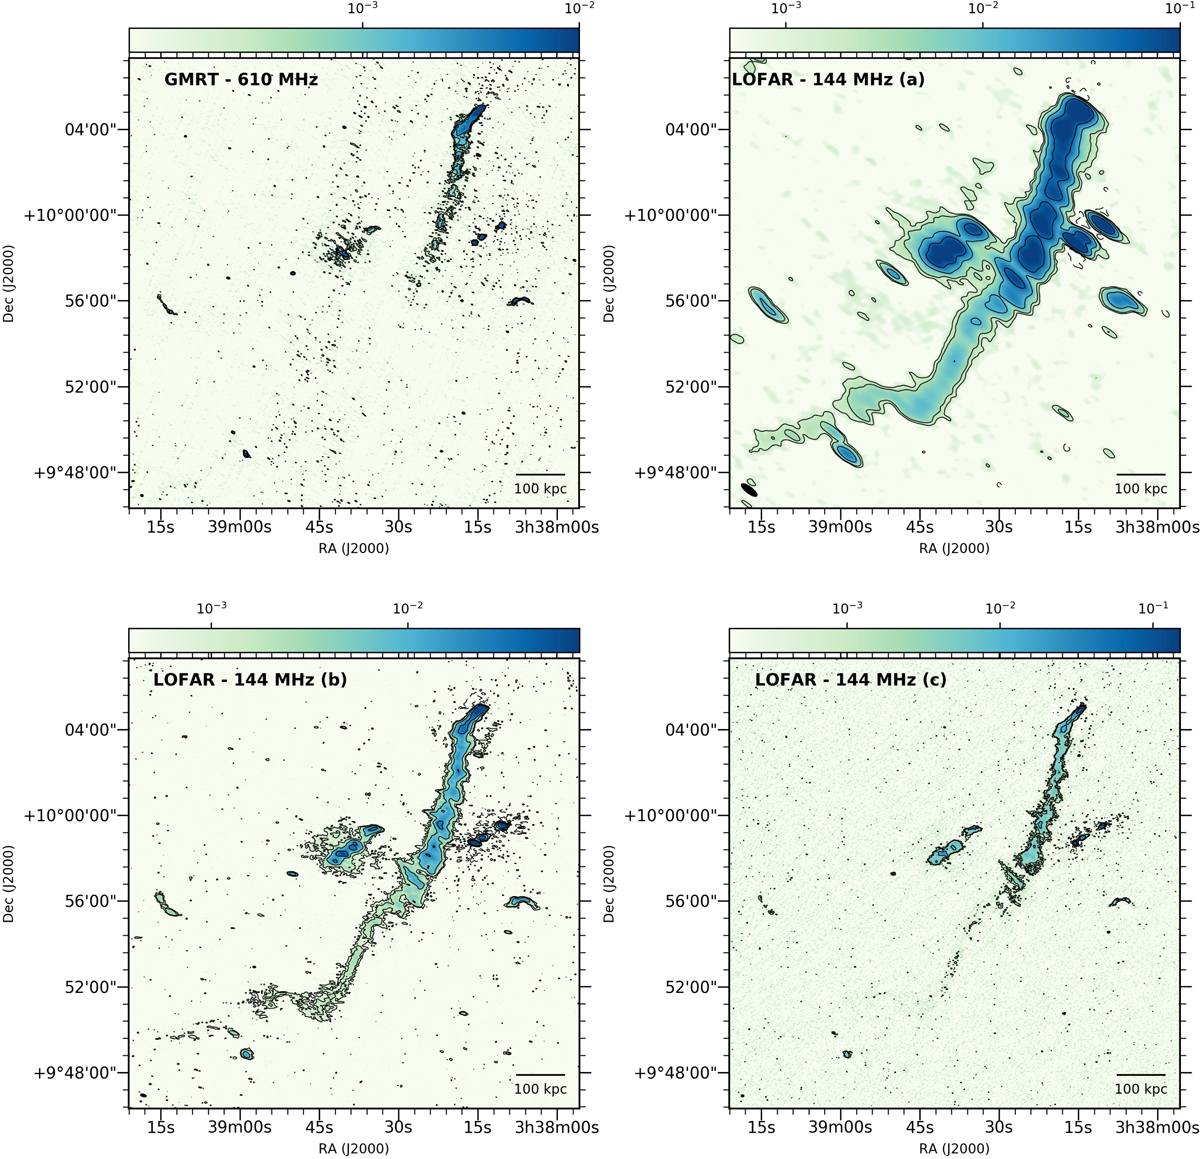
Fig. 1.
Download original image
Multi-frequency view of 2A 0335+096. Top left: GMRT image at 610 MHz, σ = 84 μJy beam−1, and a resolution of 6″ × 4″. Top right (a): LOFAR low-resolution image, σ = 517 μJy beam−1, and a resolution of 52″ × 16″. Bottom left (b): LOFAR mid-resolution image, σ = 231 μJy beam−1, and a resolution of 14″ × 5″. Bottom right (c): LOFAR high-resolution image, σ = 400 μJy beam−1, and a resolution of 6″ × 4″. We report the −3, 3, 6, 24, and 96σ levels in the LOFAR images and the −3, 3, 6, 12, and 24σ in the GMRT image. The maps are reported in units of Jy.
Current usage metrics show cumulative count of Article Views (full-text article views including HTML views, PDF and ePub downloads, according to the available data) and Abstracts Views on Vision4Press platform.
Data correspond to usage on the plateform after 2015. The current usage metrics is available 48-96 hours after online publication and is updated daily on week days.
Initial download of the metrics may take a while.