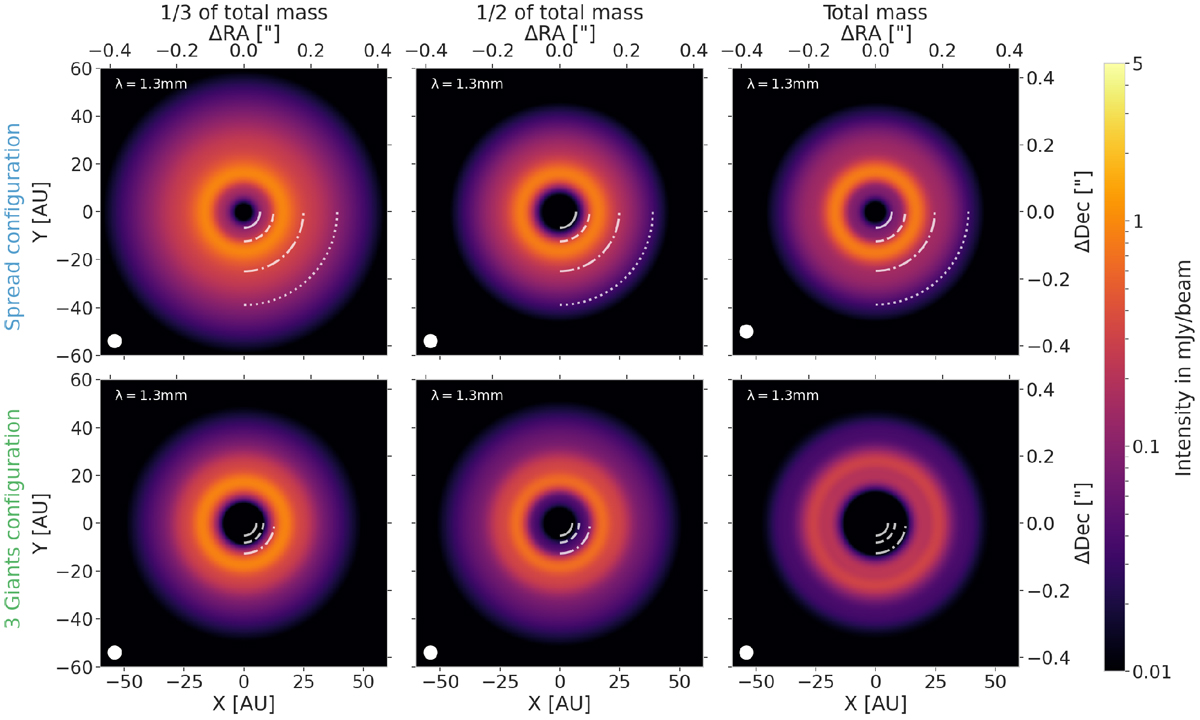
Fig. 7
Download original image
Images in total intensity at λ = 1.3 mm corresponding to the radial profiles presented in Fig. 6. The positions of the different planets are represented by the different white arcs. The beam size (0.04′′ × 0.04′′) is represented in the lower-left corner of each image by the white ellipse. In the Spread configuration, we see that the size of the disks depends on the masses of the planets. In the Three-Giants configuration, one can notice the substructures outside of the giants’ region corresponding to the orange regions of the profiles in Fig. 6 and originating from the traffic jams observed in Sect. 3.1; these traffic jams were created by the perturbed velocity profile of the disk (see Fig. A.7).
Current usage metrics show cumulative count of Article Views (full-text article views including HTML views, PDF and ePub downloads, according to the available data) and Abstracts Views on Vision4Press platform.
Data correspond to usage on the plateform after 2015. The current usage metrics is available 48-96 hours after online publication and is updated daily on week days.
Initial download of the metrics may take a while.