Fig. 4
Download original image
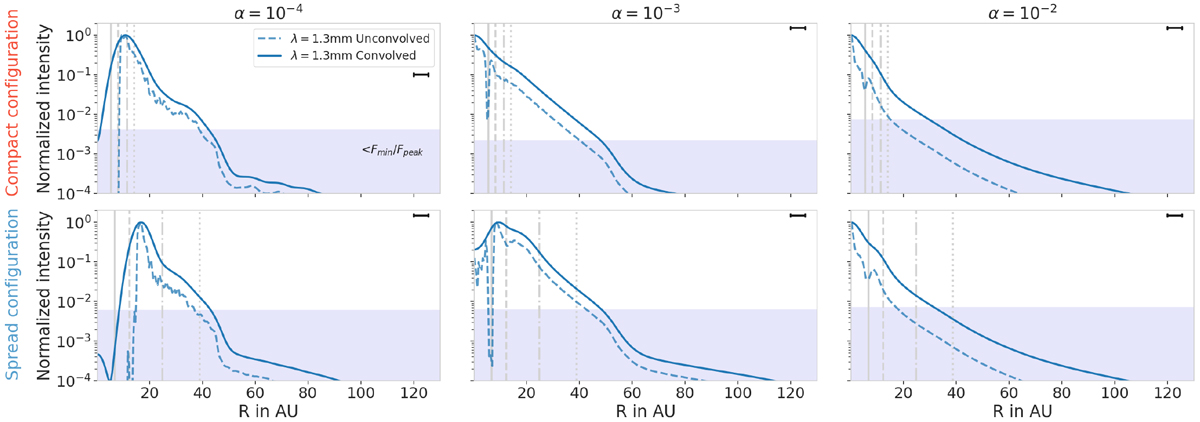
Radial profile of convolved and unconvolved images at λ = 1.3 mm with the MMSN-like aspect ratio. Each row represents a Solar System configuration, and each column represents an α viscosity. The solid lines show the radial intensity of the images normalized to the peak intensity after convolution with a beam of FWHM = 0.04′′ × 0.04′′ = 5.6 AU × 5.6 AU. The beam is represented with a black horizontal line in the upper-right corner of each panel. The dashed lines represent the normalized intensity of the unconvolved image. Vertical lines show the positions of the planets in each configuration. The light blue area shows the region where the normalized intensity is smaller than Fmin ∕Fpeak, where Fmin = 10 μJy is the minimal flux considered to be observable. The value of Fmin∕Fpeak is different from each panel as Fpeak is unique to each image, whereas Fmin is fixed. Comparing the profiles in the case of the convolved and unconvolved images shows us how many features can be missed due to a too low resolution. Regarding the Compact configuration, all substructures are smeared out in the beam.
Current usage metrics show cumulative count of Article Views (full-text article views including HTML views, PDF and ePub downloads, according to the available data) and Abstracts Views on Vision4Press platform.
Data correspond to usage on the plateform after 2015. The current usage metrics is available 48-96 hours after online publication and is updated daily on week days.
Initial download of the metrics may take a while.