Fig. C.1
Download original image
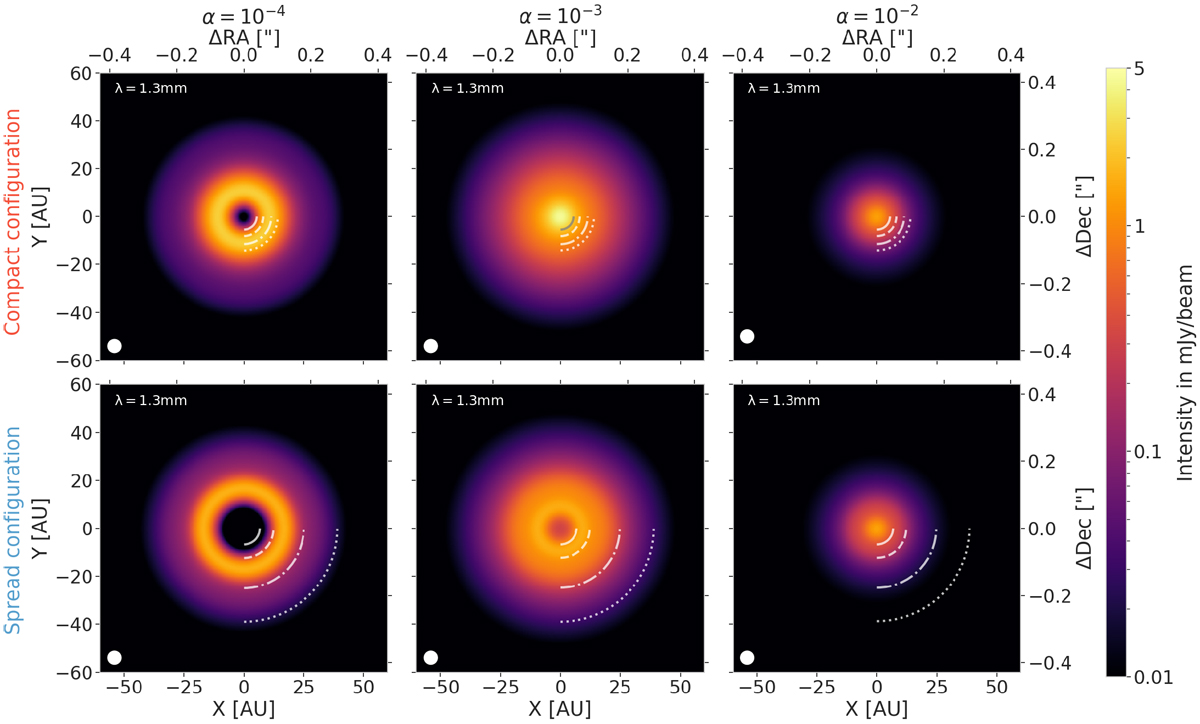
Images at λ = 1.3mm for each Solar System configuration for an MMSN-like aspect ratio. These are the images that correspond to the intensity profiles presented in Fig. 4. The beam is 0.04"×0.04" and is represented as the white circle in the lower-left corner of each panel. The white lines represent the distances of the differentplanets.
Current usage metrics show cumulative count of Article Views (full-text article views including HTML views, PDF and ePub downloads, according to the available data) and Abstracts Views on Vision4Press platform.
Data correspond to usage on the plateform after 2015. The current usage metrics is available 48-96 hours after online publication and is updated daily on week days.
Initial download of the metrics may take a while.