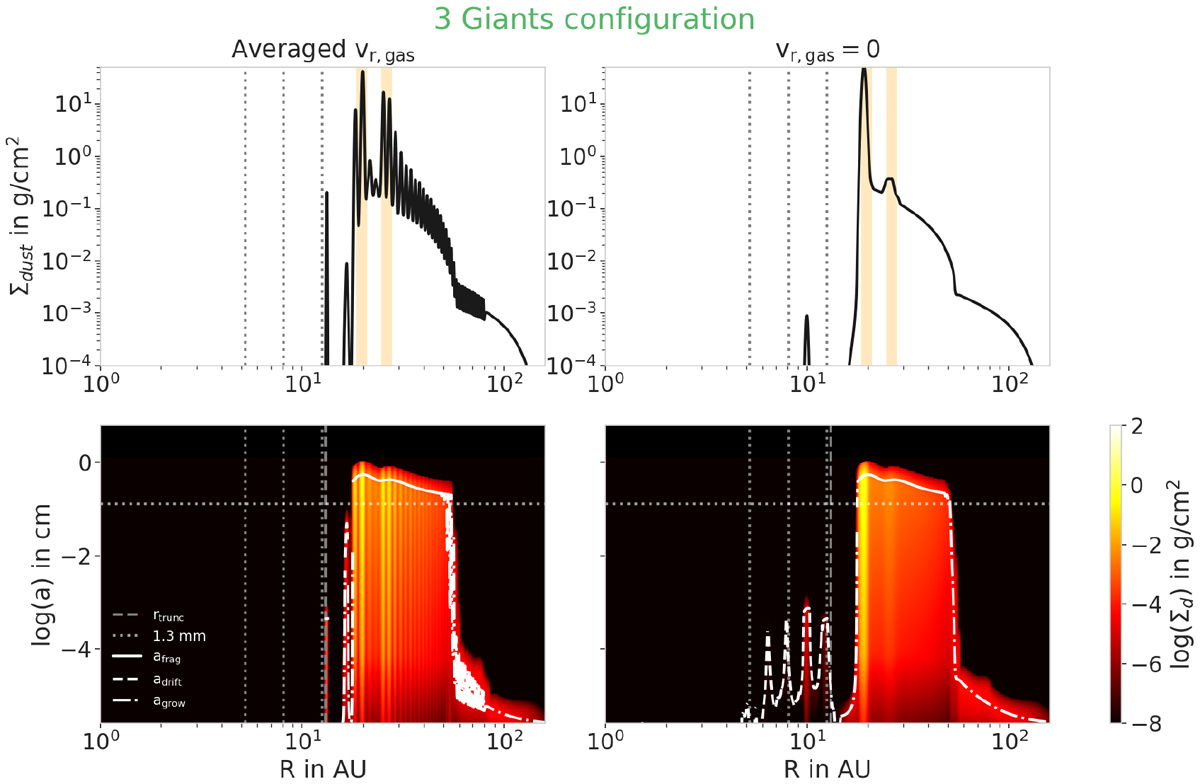
Fig. B.1
Download original image
Dust distributions in the Three-Giants configuration case: in the left panels, the velocity of the gas used as an input for the dust evolution model is the averaged velocity as presented in Fig. A.7; in the right panels, the gas velocity is taken to be null. The first row presents the integrated dust distribution along all the dust sizes, representingthe total dust distribution in the disk, whereas the second row presents the classic dust distributions as in Sect. 3.1. The presence of spikes in the left panel shows that the radial gas velocities are indeed responsible for the dust accumulations in additional rings exterior to the positions of the planets.
Current usage metrics show cumulative count of Article Views (full-text article views including HTML views, PDF and ePub downloads, according to the available data) and Abstracts Views on Vision4Press platform.
Data correspond to usage on the plateform after 2015. The current usage metrics is available 48-96 hours after online publication and is updated daily on week days.
Initial download of the metrics may take a while.