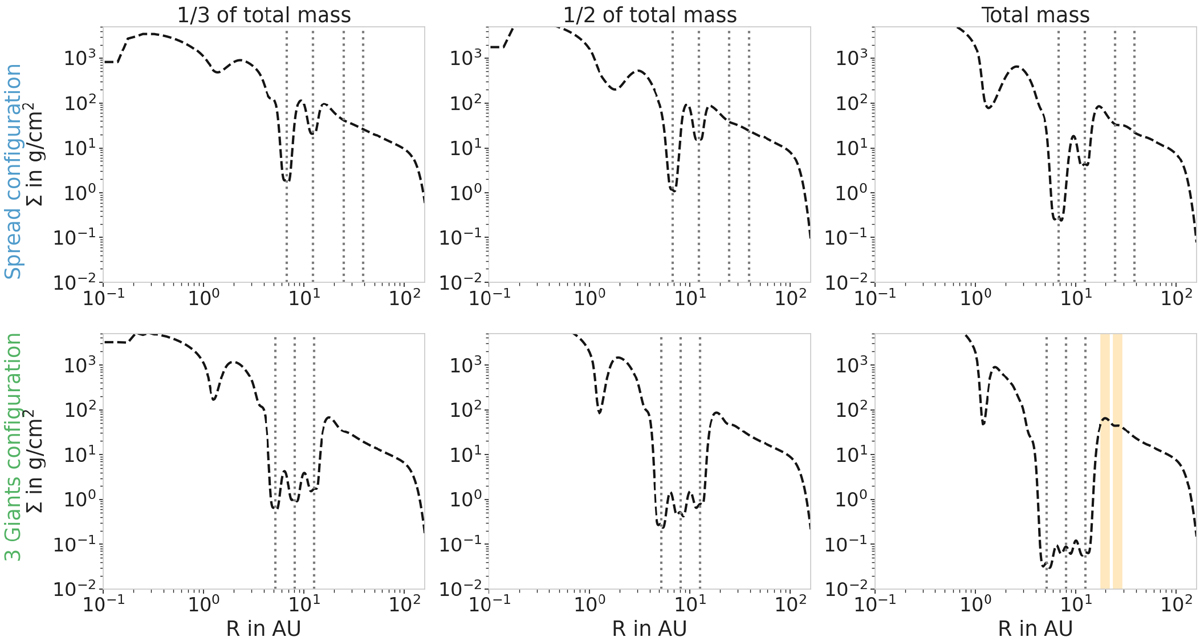
Fig. A.5
Download original image
Time- and azimuthal-averaged gas surface density profiles for the different configurations. Vertical dotted lines represent the positions of each planet. As expected, more massive planets create deeper gaps. In the Three-Giants case, the giants are close enough to one another to always create a common gap. The masses of the planets then dictate how deep the gap is and how much gas is present in the gap between them. The two orange vertical lines show the positions of the rings seen in the synthetic millimeter images (Fig. 6). We see that they do not correspond to strong features in the gas disk and are located far from the giants’ orbits.
Current usage metrics show cumulative count of Article Views (full-text article views including HTML views, PDF and ePub downloads, according to the available data) and Abstracts Views on Vision4Press platform.
Data correspond to usage on the plateform after 2015. The current usage metrics is available 48-96 hours after online publication and is updated daily on week days.
Initial download of the metrics may take a while.